Date: 5/11/2023
Form: 6-K - Report of foreign issuer [Rules 13a-16 and 15d-16]


UNITED STATES
SECURITIES AND EXCHANGE COMMISSION
Washington, D.C. 20549
FORM 6-K
REPORT OF FOREIGN PRIVATE ISSUER PURSUANT TO RULE 13a-16 OR 15d-16 UNDER THE SECURITIES EXCHANGE ACT OF 1934
For the month of May 2023
Commission File Number: 001-39519
Vitru Limited
(Exact name of registrant as specified in its charter)
Rodovia José Carlos Daux, 5500, Torre Jurerê A,
2nd floor, Saco Grande, Florianópolis, State of
Santa Catarina, 88032-005, Brazil
+55 (47) 3281-9500
(Address of principal executive office)
Indicate by check mark whether the registrant files or will file annual reports under cover of Form 20-F or Form 40-F:
Form 20-F | X | Form 40-F | |
Indicate by check mark if the registrant is submitting the Form 6-K in paper as permitted by Regulation S-T Rule 101(b)(1):
Yes | | No | X |
Indicate by check mark if the registrant is submitting the Form 6-K in paper as permitted by Regulation S-T Rule 101(b)(7):
Yes | | No | X |
TABLE OF CONTENTS
Exhibit No. | Description |
99.1 | Earnings Release dated May 11, 2023 – Vitru Limited First Quarter 2023 Financial Results |
SIGNATURE
Pursuant to the requirements of the Securities Exchange Act of 1934, the registrant has duly caused this report to be signed on its behalf by the undersigned, thereunto duly authorized.
| Vitru Limited. | |
| | |
| | |
| By: | /s/ Carlos Henrique Boquimpani de Freitas |
| Name: | Carlos Henrique Boquimpani de Freitas |
| Title: | Chief Financial and Investor Relations Officer |
| | |
Date: May 11, 2023 | | |
Exhibit 99.1

Vitru Limited
announces
First Quarter 2023
Financial Results

Florianopolis, Brazil, May 11, 2023 – Vitru Limited, or Vitru (Nasdaq: VTRU), the leading pure-player in the post-secondary digital education market in Brazil, today reported financial and operating results for the three-month period ended March 31, 2023 ("first quarter 2023” or "1Q23”). Financial results are expressed in Brazilian reais (R$) and are presented in accordance with International Financial Reporting Standards (IFRS). Vitru operates its hubs under the Uniasselvi and UniCesumar brands with 862.8 thousand students enrolled in digital education undergraduate and graduate courses, and 2,248 hubs distributed throughout Brazil, in each case as of March 31, 2023.
Vitru announces the beginning of the transition period for its co-CEO structure and confirms its leadership position in Digital Education
To our shareholders
In August 2021, when Vitru announced the agreement for a business combination with Cesumar – Centro de Ensino Superior de Maringá Ltda or "UniCesumar”, it mentioned that the planning of the integration period would start, in which William Matos would occupy the position of co-CEO of Vitru, together with Pedro Graça, after the closing of said transaction, which took place in May 2022.
The integration period brought together two executives with significant track-records in the Brazilian education sector and was key to benefit from the potential and best practices of both brands. Pedro Graça, with years of experience in the technology and distance learning sectors, joined Vitru in 2016 when Uniasselvi had approximately 80,000 students enrolled in the distance learning segment. William Matos is the mastermind behind UniCesumar’s approach to distance learning, which at the time of the business combination with Vitru, had over 300,000 students and had achieved high indicators of academic quality.
The integration process turned Vitru – the parent company of Uniasselvi and UniCesumar – into a leading company in the distance learning higher education sector in Brazil, with 2,248 hubs across the country that serve around 800,000 digital education students (as of March 31, 2023), a consolidated Net Revenue of approximately R$1.6 billion and adjusted EBITDA of approximately R$570 million in the 12 months ended March 31, 2023, and an Adjusted EBITDA margin of 36% for the same period.
The planned co-CEO structure accelerated the integration of the brands and now allows us to move into a new phase: Pedro Graça will leave his executive role in the Vitru group within the next six months and will have a seat on the Board of Directors. William Matos will take over as the sole CEO of the Company.
According to Carlos Eduardo Martins, Chairman of the Company's Board of Directors: "Vitru's mission is to democratize access to education in Brazil through a digital ecosystem and enable each student to create their own success story. We would like to thank Pedro Graça for his resolute dedication to fulfilling this mission and successful trajectory over the years. His future presence on the Board of Directors will uphold the necessary alignment and the continuity of our Company’s project into a new era. I am absolutely convinced that William Matos will continue to lead Vitru with the same endeavor, discipline and determination demonstrated by his pioneering vision at UniCesumar, which I believe was fundamental for developing of the brand and value creation since the beginning of its distance learning business until the business combination with Vitru.”
1Q23 Results | 2 |
Pedro Graça said: "I am very proud of what has been built over the last few years together with the team, in which we expanded Uniasselvi throughout Brazil, created Vitru, executed a successful IPO on NASDAQ in 2020 and advanced to the business combination process of UniCesumar, turning Vitru into the leading company in the distance learning higher education sector in Brazil.”
William Matos said: "I am very confident in our ability, through Vitru, to maintain and expand the legacy of UniCesumar as well as that of Uniasselvi, two institutions built with an absolute focus on academic quality, delivering a differentiated teaching experience to our hundreds of thousands of students across the country.”
Regarding the first quarter of 2023, Vitru was able to deliver another set of solid results. There was an accumulated growth of 17.7% of its 1Q23 consolidated intake in the DE Undergraduate segment when compared to the combined (pro-forma) intake of Uniasselvi plus UniCesumar in 1Q22. The average ticket growth is also worth mentioning, including UniCesumar’s, following the pricing repositioning that started to be implemented following the closing of the business combination.
The successful evolution of the operational indicators was reflected in the financial performance. Consolidated Net Revenue grew 149.9% when comparing 1Q23 with the same period in 2022. The Consolidated Adjusted EBITDA increased 255.5% reaching R$168.5 million. The Adjusted EBITDA margin of 1Q23 grew 11.2 percentage points, reaching 37.9%, this positive performance reflects the integration process and best practices exchange between our brands.
On May 5, 2023, Vitru Brasil, a fully owned subsidiary of Vitru Limited, signed the indenture of its second simple, secured, and non-convertible debentures (local bonds in BRL), amounting to R$190.0 million at an interest rate indexed to the CDI plus a spread of 2.60%, for a five-year maturity. The net proceeds from the issuance of the debentures will be used by Vitru Brasil to extend the maturity profile of its indebtedness and/or for working capital purposes.
Our corporate governance agenda is one of the priorities within the integration process. This quarter, the new Code of Conduct was released, in line with markets’ best practices and aligned with the constant changes in society and the business environment in which Vitru operates.
Looking forward, we are still focused into one of our main goals for 2023: the consolidation of two leading institutions that share similar values and cultures. We strongly believe in our ability to continue the smooth integration of our brands and build an even stronger and purpose-driven company, by bringing together the best solutions and technology for our students while maximizing synergies. We are committed to our mission of positively impacting the lives of hundreds of thousands, if not, millions of Brazilians through our high-quality digital education offerings. Go Vitru!
Sincerely,
Pedro Graça & William Matos
Vitru's co-CEOs
1Q23 Results | 3 |
CONFERENCE CALL AND WEBCAST INFORMATION
Vitru will discuss its first quarter 2023 results via live webcast
When: Thursday, May 11, 2023 at 5:00 p.m. EST (6:00 p.m. BRT)
Webcast: https://investors.vitru.com.br/
Replay: available on our website
Carlos Freitas | |
Chief Financial and Investor Relations Officer | |
| |
| |
Maria Carolina de Freitas Gonçalves | Investor Relations Contact |
Investor Relations Manager | ir@vitru.com.br |
1Q23 Results | 4 |
HIGHLIGHTS OF 1Q23 AND THEREAFTER
| ◾ | Launch of the transition period for its co-CEO structure between Pedro Graça and William Matos, in which Pedro Graça will leave his executive assignment at Vitru in up to six months and will take a seat on the Board of Directors, when William Matos will take over as the sole CEO of the Company; |
| ◾ | Approval for the launch of our first Share Buyback Program for the potential acquisition of up to 500,000 shares; |
| ◾ | The issuance of our second debentures by Vitru Brasil, for an amount of R$190 million at an interest rate of CDI+2.6% per year and a five-year maturity; |
| ◾ | 886.1k students as of the end of 1Q23, with an increase of 127.7% as compared to the end of 1Q22, with approximately 97.4% of students in Digital Education courses; |
| ◾ | Net revenue in the core Digital Education Undergraduate segment increased by 105.6% in 1Q23 compared to 1Q22, with Consolidated Net Revenue up 149.8%; |
| ◾ | Consolidated Adjusted EBITDA increased 255.5% in 1Q23 compared to 1Q22, with Adjusted EBITDA Margin increasing 11.2 percentage points (p.p.) to 37.9% in 1Q23 compared to 1Q22; |
| ◾ | Adjusted Cash Flow from Operations increased 172.9% to R$128.0 million in 1Q23 compared to 1Q22, with an Adjusted Cash Flow Conversion from Operations of 79.8% compared to 115.8% in 1Q22; and |
| ◾ | Adjusted Net Income was up 206.0% in 1Q23 compared to 1Q22, reaching R$81.1 million. |
Table 1: Key financial highlights
R$ million |
| 1Q231 | 1Q22 | % Chg |
Net Revenue | | 444.2 | 177.8 | 149.8% |
DE Undergraduate Net Revenue | | 320.7 | 156.0 | 105.6% |
Adjusted EBITDA2 | | 168.5 | 47.4 | 255.5% |
Adjusted EBITDA Margin | | 37.9% | 26.7% | 11.2 p.p. |
Adjusted Net Income3 | | 81.1 | 26.5 | 206.0% |
Adjusted Cash Flow from Operations4 | | 128.0 | 46.9 | 172.9% |
Adjusted Cash Flow Conversion from Operations4 | | 79.8% | 115.8% | (36.0) p.p. |
| (1) | 1Q23 results reflect the consolidation of UniCesumar. |
| (2) | For a reconciliation of Adjusted EBITDA, see "—Reconciliations of Non-GAAP Financial Measures—Reconciliation of Adjusted EBITDA” at the end of this document. |
| (3) | For a reconciliation of Adjusted Net Income, see "—Reconciliations of Non-GAAP Financial Measures—Reconciliation of Adjusted Net Income” at the end of this document. |
| (4) | For a reconciliation of Adjusted Cash Flow from Operations and Adjusted Cash Flow Conversion from Operations, see "—Reconciliations of Non-GAAP Financial Measures—Reconciliation of Adjusted Cash Flow Conversion from Operations” at the end of this document. |
1Q23 Results | 5 |
OPERATING RESULTS
Student base and hubs
We consider the number of enrolled students an important operational metric for Vitru. As of March 31, 2023, Vitru had 886.1 thousand students enrolled in the courses it provides, an increase of 127.7% compared to the number of enrolled students over the same period of the prior year.
The percentage of digital education students to total enrolled students is a relevant metric, which we believe best demonstrates the focus on digital education (comprising both undergraduate courses and continuing education courses) and its relevance to the services offered. As of March 31, 2023, students enrolled in digital education courses represented 97.4% of the total number of enrolled students, slightly down, from the percentage achieved on March 31, 2022 (i.e. before the business combination with UniCesumar), given that UniCesumar has a larger representativeness of on-campus students than Uniasselvi in its student base. On an organic basis, students enrolled in digital education represented 98.6% of the total number of enrolled students, up 0.4 p.p. from 1Q22.
It is important to highlight that the number of hubs is one of the drivers that enable the Company to increase its enrolled student base. A material portion of Vitru’s growth is driven by the expansion and subsequent maturation of the hubs.
Vitru has expanded its operations and geographic presence throughout Brazil with the opening of new hubs in the last few years. In fact, 92.5% of the current 2,248 hubs are still ramping up, representing a substantial growth avenue: the current average maturation ratio of hubs in expansion is only 46.5%. The Company estimates that a typical hub reaches its full capacity in terms of the number of students (and hence is deemed to be mature) after seven or eight years of operations.
Table 2: Student base and Hubs
'000 |
| 1Q231 | 1Q22 | 4Q221 | Δ1Q23 x 1Q22 | Δ1Q23 x 4Q22 |
Total enrolled students | | 886.1 | 389.2 | 768.4 | 127.7% | 15.3% |
% Digital education to total enrolled students | | 97.4% | 98.2% | 97.3% | (0.8) p.p. | 0.1 p.p. |
Number of digital education students | | 862.8 | 382.1 | 747.5 | 125.8% | 15.4% |
Undergraduate students | | 799.7 | 342.4 | 696.3 | 133.5% | 14.9% |
Graduate students | | 63.1 | 39.7 | 51.3 | 58.9% | 23.0% |
Number of on-campus students | | 23.2 | 7.1 | 20.9 | 226.8% | 11.1% |
Undergraduate students | | 22.9 | 7.1 | 20.6 | 222.5% | 11.2% |
Graduate students | | 0.313 | - | 0.289 | n.a. | 8.3% |
Number of hubs2 | | 2,248 | 981 | 2,170 | 129.2% | 3.6% |
% of Expansion hubs (i.e., excluding Base hubs) | | 92.5% | 91.4% | 91.2% | 1.1 p.p. | 1.3 p.p. |
Theoretical maturation index3 | | 46.5% | 37.1% | 41.8% | 9.4 p.p. | 4.7 p.p. |
| (1) | Consolidates the number of enrolled students and hubs of UniCesumar operation since May 20, 2022. |
| (2) | Consolidates the number of hubs of UniCesumar, excluding its five international hubs. |
| (3) | The Company calculates the theoretical maturation index as the actual number of students per hub of the Expansion hubs divided by the theoretical number of students it expects to achieve as of the maturity of the same hubs. The index comprises all Expansion hubs as of the end of each period, and hence it can actually decrease in a given quarter as new Expansion hubs are opened. |
1Q23 Results | 6 |
Intake by Uniasselvi and UniCesumar combined in 1Q23 increased by 17.7% when compared to the same quarter of the previous year.
In addition, note that the Company posted strong intake results in the 2022 intake cycles (40.3% growth in 2022.1 versus 2021.1 intake cycle and 30.8% growth in 2022.2 versus 2021.2 intake cycle, both considering the consolidated intakes of Uniasselvi and UniCesumar). This performance resulted in a change in the mix of the student base, with a higher percentage of freshmen students and a lower percentage of senior students, as shown in the following chart. Once the drop-out rates are higher in the first two semesters of a given course, the above-mentioned strong intakes in 2022 explain the deterioration of the retention rates in 1Q23.
It is important to highlight that the number of hubs is one of the drivers that enable the Company to increase its enrolled student base. A material portion of Vitru’s growth is driven by the expansion and subsequent maturation of the hubs.
Table 3: Key operational highlights
'000 |
| 1Q23 | 1Q22 | % Chg |
Total DE undergraduate intake | | 412.6 | 350.6 | 17.7% |
Uniasselvi DE undergraduate intake | | 207.6 | 170.9 | 21.5% |
UniCesumar DE undergraduate intake | | 205.0 | 179.7 | 14.1% |
DE undergraduate retention rate | | 74.7% | 79.9% | (5.2) p.p. |
Uniasselvi DE undergraduate retention rate | | 71.6% | 74.9% | (3.3) p.p. |
UniCesumar DE undergraduate retention rate | | 77.9% | 85.4% | (7.5) p.p. |
1Q23 Results | 7 |
Tuitions and Ticket
Table 4: Tuitions1
R$ million | 1Q23 | 1Q223 | % Chg |
Uniasselvi DE undergraduate tuitions | 292.7 | 246.6 | 18.7% |
Average ticket Uniasselvi DE undergraduate (R$/month)2 | 315.2 | 300.6 | 4.9% |
UniCesumar DE undergraduate tuitions | 221.5 | 185.4 | 19.5% |
Average ticket UniCesumar DE undergraduate (R$/month)2 | 226.2 | 221.0 | 2.4% |
Total DE undergraduate tuitions | 514.2 | 432.0 | 19.0% |
Average ticket Vitru DE undergraduate (R$/month)2 | 269.5 | 260.4 | 3.5% |
| (1) | Tuitions are net of cancellations. |
| (2) | In the first quarter of each year, the Company calculates the "Average Ticket DE undergraduate (R$/month)” as the sum of the Digital Education Undergraduate Tuitions net of cancellations of the quarter divided by the average number of students between the beginning and the end of the quarter. |
| (3) | UniCesumar tuition and ticket comprehend the period not yet consolidated within Vitru, once the consolidation of UniCesumar within Vitru’s financial statements started on May 20, 2022. |
The strength of Vitru’s model and the sustainability of its growth can be demonstrated by the total amount charged for course tuitions from digital education undergraduate students (which is the sum of gross revenue and the hub partners’ portion of the tuitions less other academic revenue and cancellations).
DE Undergraduate tuitions for 1Q23 amounted to R$514.2 million, an increase of 108.5% compared to the R$246.6 million recorded in 1Q22. This growth rate primarily reflects the maturation of expansion hubs (i.e. hubs that are not yet deemed to be mature) through the organic increase in the number of students enrolled in digital education undergraduate courses plus the consolidation of UniCesumar figures as a result of the business combination.
The average monthly ticket for Uniasselvi DE Undergraduate courses increased by 4.9%, from R$300.6 in 1Q22 to R$315.2 in 1Q23. We believe that this increase in the average ticket in DE Undergraduate segment, despite the challenging macroeconomic conditions in Brazil, is indicative of the resilience of Vitru’s organic academic model. Going forward, we see the potential for the contribution of new courses with higher monthly tickets, such as Nursing, which only was launched in the second semester of 2021.
The average monthly ticket for UniCesumar DE Undergraduate courses increased 2.4% to R$226.2 in 1Q23 compared to R$221.0 in 1Q22. As part of the best practices currently being exchanged between the entities, we are working to improve UniCesumar’s average tickets in line with the pricing strategies being applied by Uniasselvi in the last few years, which has differentiated it from the other players in the market. We believe that this 2.4% growth in UniCesumar’s average ticket in 1Q23 compared to 1Q22, after a sizable decrease throughout 2022, is evidence of the success of our approach.
Lastly, in the last few quarters, we have been observing a continued increase in the interest of younger students (i.e., persons under 25 years old) in our digital education solutions, which we believe is evidence that, following the COVID-19 pandemic, a greater share of the new generation of students is accepting digital solutions as a natural choice for post-secondary education.
1Q23 Results | 8 |
FINANCIAL RESULTS
Net Revenue
Consolidated Net Revenue in 1Q23 was R$444.2 million, up 149.8% from 1Q22. This growth was mainly driven by the increase in the number of enrolled students in the DE Undergraduate segment as well as higher average tickets in this segment plus the business combination with UniCesumar.
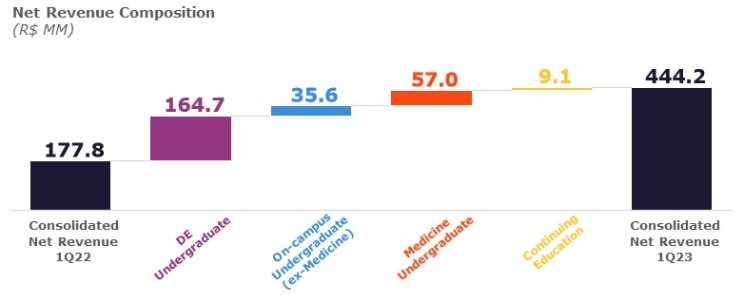
Net Revenue from digital education undergraduate courses in 1Q23 was R$320.7 million, up 105.6% from R$156.0 million in 1Q22. This achievement was primarily driven by an increase in the student base, as boosted by the business combination with UniCesumar, the results of the aforementioned expansion and maturation of operational hubs, and by a higher average ticket in this segment as previously presented.
Net Revenue from on-campus undergraduate courses (ex-medical courses) in 1Q23 amounted to R$45.6 million, an increase of 357.0% from R$10.0 million in 1Q22. This effect is primarily due to the business combination with UniCesumar, which historically had a higher representation of its total income from on-campus operations than Uniasselvi. Net Revenue from the whole on-campus undergraduate segment (including UniCesumar’s medical courses) reached R$102.6 million in 1Q23, an increase of 926.0% from R$10.0 million in 1Q22, given the representativeness of UniCesumar’s on-campus activities.
Net Revenue from continuing education courses for 1Q23 was R$20.9 million, up 77.1% from R$11.8 million in 1Q22. In addition to graduate courses, our continuing education business includes technical courses and professional qualification courses. We believe this is a potential growth area and is part of our strategy to expand complementary offerings throughout our students’ lifelong journey.
1Q23 Results | 9 |
Table 5: Net Revenue Breakdown
R$ million |
| 1Q231 | 1Q22 | % Chg |
Digital education undergraduate | | 320.7 | 156.0 | 105.6% |
On-campus undergraduate | | 102.6 | 10.0 | 926.0% |
Continuing education | | 20.9 | 11.8 | 77.1% |
Net Revenue | | 444.2 | 177.8 | 149.8% |
| (1) | 1Q23 results reflect the consolidation of UniCesumar. |
Cost of Services
Cost of services in 1Q23 amounted to R$151.3 million, an increase of 132.4% compared to R$65.1 million reported in 1Q22. In addition to the impact of the consolidation of UniCesumar, as a percentage of Net Revenue, a reduction of 2.6 p.p. is notable when comparing 1Q22 with 1Q23, mainly due to a decrease in the carried depreciation and amortization costs ratio over our Net Revenue as a result of the addition of the UniCesumar’s revenue in our consolidated numbers. We note that the cost of services includes certain restructuring costs (besides the aforementioned depreciation and amortization cost), which combined amounted to R$21.9 million in 1Q23 and R$14.9 million in 1Q22.
Cost of services as reported in the Adjusted EBITDA calculation (without the aforementioned restructuring costs and depreciation and amortization expenses) was R$129.5 million in 1Q23 and R$50.2 million in 1Q22, representing a year-over-year increase of 158.0%, and an increase of 1.0 p.p. as a percentage of Net Revenue, mainly due to the increased representativeness of the on-campus segment (a business with lower margins) after the business combination with UniCesumar.
Table 6: Cost of Services
R$ million |
| 1Q231 | 1Q22 | % Chg |
Cost of Services | | 151.3 | 65.1 | 132.4% |
(-) Depreciation and amortization | | (19.7) | (13.0) | 51.2% |
(-) Restructuring expenses | | (2.2) | (1.9) | 15.8% |
Cost of Services for Adj. EBITDA calculation | | 129.5 | 50.2 | 158.0% |
as % of Net Revenue | | 29.2% | 28.2% | 1.0 p.p. |
| (1) | 1Q23 results reflect the consolidation of UniCesumar. |
1Q23 Results | 10 |
Gross Profit and Gross Margin
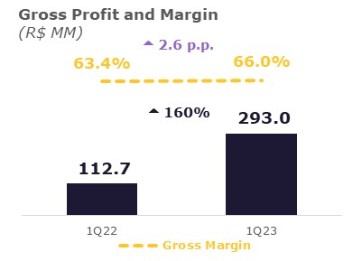
Gross Profit in 1Q23 was R$293.0 million, an increase of 159.9% compared to R$112.7 million in 1Q22, which was primarily due to the contribution of UniCesumar to our consolidated figures. Gross Margin increased 2.6 p.p. from 63.4% to 66.0% in 1Q23, which was primarily attributable to a decrease in overall Cost of Services as a percentage of Net Revenue, for the aforementioned reasons including the decrease of the carried amount of Depreciation and Amortization ratio.
Operating Expenses
Selling Expenses
Selling expenses in 1Q23 amounted to R$90.1 million, an increase of 87.7% compared to R$48.0 million in 1Q22. In addition to the contribution of UniCesumar to our consolidated figures (including the amortization expenses of certain intangible assets arising from the Purchase Price Allocation related to the business combination with UniCesumar), this increase is primarily attributable to our focus on our Digital Education segment, which led to increased selling expenses with online advertising aimed at attracting new students.
Selling expenses as reported in the Adjusted EBITDA calculation (i.e., excluding depreciation and amortization expenses) amounted to R$76.5 million in 1Q23 and R$47.8 million in 1Q22, representing a year-on-year increase of 60.0%. As a percentage of Net Revenue, consolidated Selling Expenses for Adjusted EBITDA calculation decreased from 26.9% in 1Q22 to 17.2% in 1Q23. This decrease is mainly attributable to the fact that, in UniCesumar’s intake process, the hub partners are much more active and have higher intake responsibilities (and hence bear a significant part of the intake costs of the cycle) compared to in Uniasselvi’s overall intake process.
Table 7: Selling Expenses
R$ million |
| 1Q231 | 1Q22 | % Chg |
Selling Expenses | | 90.1 | 48.0 | 87.7% |
(-) Depreciation and amortization | | (13.6) | - | n.a. |
(-) M&A and pre-offering expenses | | - | (0.2) | n.a. |
Selling Expenses for Adj. EBITDA calculation | | 76.5 | 47.8 | 60.0% |
as % of Net Revenue | | 17.2% | 26.9% | (9.7) p.p. |
| (1) | 1Q23 results reflect the consolidation of UniCesumar. |
1Q23 Results | 11 |
General and Administrative Expenses
General and Administrative (G&A) expenses in 1Q23 amounted to R$54.4 million, an increase of 294.2%, compared to 1Q22. This was primarily due to higher depreciation and amortization expenses from the consolidation of UniCesumar (including the amortization expenses of certain intangible assets arising from the Purchase Price Allocation related to the business combination), in addition to the contribution of UniCesumar’s operations to our consolidated figures.
G&A expenses as reported in the Adjusted EBITDA calculation amounted to R$29.3 million in 1Q23 and R$12.6 million in 1Q22, representing an increase of 132.5%, which reflects the consolidation of UniCesumar’s results in our financial statements. G&A expenses as reported in the Adjusted EBITDA calculation reached 6.6% of Net Revenue in 1Q23, a decrease of 0.5 p.p. compared to 7.1% of Net Revenue in 1Q22, which was attributable to synergies in our corporate structure as a result of the ongoing implementation of the integration of both entities.
Table 8: G&A Expenses
R$ million |
| 1Q231 | 1Q22 | % Chg |
General and Administrative (G&A) Expenses | | 54.4 | 13.8 | 294.2% |
(-) Depreciation and amortization expenses | | (19.0) | (1.9) | 900.0% |
(-) Share-based compensation plan | | (0.1) | 5.5 | n.a. |
(-) Restructuring, M&A and pre-offering expenses | | (6.0) | (4.8) | 25.0% |
G&A Expenses for Adj. EBITDA calculation | | 29.3 | 12.6 | 132.5% |
as % of Net Revenue | | 6.6% | 7.1% | (0.5) p.p. |
| (1) | 1Q23 results reflect the consolidation of UniCesumar. |
Net Impairment Losses on Financial Assets
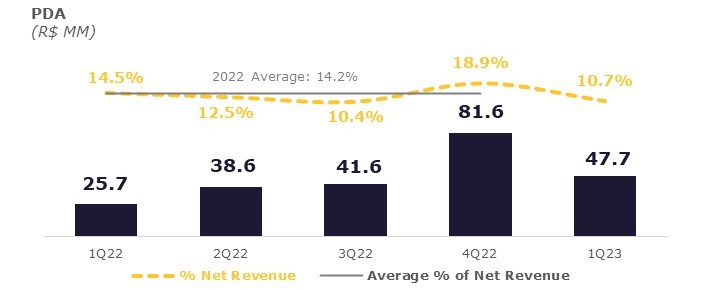
Net impairment losses on financial assets represent the provisions for doubtful accounts (PDA). In 1Q23, PDA expenses were R$47.7 million, which represents 10.7% of the Net Revenue in the period, while in 1Q22 PDA expenses amounted to R$25.7 million, equivalent to 14.5% of the Net Revenue. This decrease of 3.8 p.p. in our PDA expenses as a percentage of Net Revenue in 1Q23 compared to 1Q22 was primarily due to the consolidation of UniCesumar’s results in our consolidated figures. It is important to highlight that UniCesumar has more effective onboarding and retention processes and procedures than Uniasselvi’s, which we believe represent a solid opportunity in the medium term for synergies via the broader use of such best practices for both brands, improving our consolidated PDA levels.
1Q23 Results | 12 |
Adjusted EBITDA
Adjusted EBITDA in 1Q23 amounted to R$168.5 million, an increase of 255.5% from R$47.4 million in 1Q22. Adjusted EBITDA Margin was 37.9%, an 11.2 p.p. increase compared to 26.7% for 1Q22. This year-on-year increase in the Adjusted EBITDA reflects mainly the contribution of UniCesumar’s results to our consolidated figures, as well as reflecting the success of combined operational results.
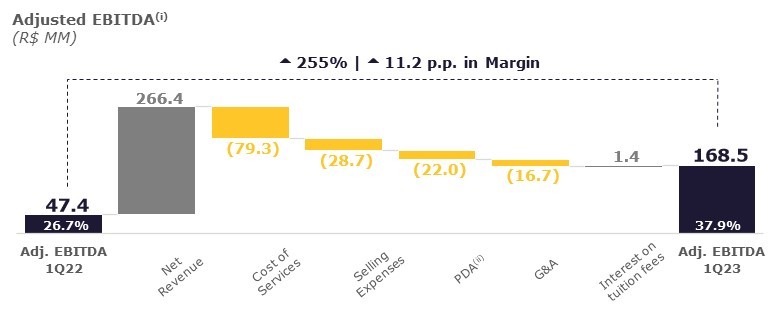
Notes: (i) all figures in this graph include the adjustments applied in our definition of Adjusted EBITDA; (ii) PDA is defined as "Net impairment losses on financial assets” in our Financial Statements.
Adjusted Net Income
Adjusted Net Income in 1Q23 was R$81.1 million, an increase of 206.0% compared to 1Q22. This year-on-year increase reflects the growth in Adjusted EBITDA in 1Q23 compared to 1Q22 as previously described, boosted by the consolidation of UniCesumar’s results within Vitru.

1Q23 Results | 13 |
Cash Flow and Cash Conversion from Operations
Adjusted Cash Flow from Operations amounted to R$128.0 million in 1Q23, an increase of 172.9% compared to 1Q22. This substantial improvement in cash flow generation was primarily the contribution of UniCesumar’s results to our consolidated figures: UniCesumar has certain characteristics, such as more positive working capital dynamics in the DE Undergraduate segment and the strength of its Medical business, which make it a strong contributor to our consolidated cash flow generation.
Adjusted Cash Flow Conversion from Operations amounted to 79.8% in 1Q23, which Vitru believes to be a solid ratio although it represented a reduction of 36.0 p.p. compared to the conversion ratio achieved in 1Q22 (115.8%), which was unusually high due to a few one-off working capital optimization initiatives taken in March 2022, when certain payments were renegotiated to fall due in April 2022.
Table 9: Cash Flow & Cash Conversion
R$ million |
| 1Q231 | 1Q22 | % Chg |
Cash Flow from Operations | | 131.2 | 50.7 | 158.7% |
(+) Income tax paid | | (3.1) | (3.8) | (18.4)% |
Adjusted Cash Flow from Operations | | 128.0 | 46.9 | 172.9% |
Adjusted EBITDA | | 168.5 | 47.4 | 255.5% |
(-) M&A, pre-offering expenses and restructuring expenses | | (8.1) | (6.9) | 17.4% |
Adjusted EBITDA excluding M&A, pre-offering expenses and restructuring expenses | | 160.4 | 40.5 | 296.0% |
Adjusted Cash Flow Conversion from Operations2 | | 79.8% | 115.8% | (36.0) p.p. |
| (1) | 1Q23 results reflect the consolidation of UniCesumar. |
| (2) | The Company calculates Adjusted Cash Flow Conversion from Operations as adjusted cash flow from operations (which we calculate as cash from operations plus income tax paid) divided by Adjusted EBITDA (as defined above but without taking non-recurring expenses, related to M&A, pre-offering expenses and restructuring expenses, into consideration). Adjusted Cash Flow Conversion from Operations is a non-GAAP measure. The calculation of Adjusted Cash Flow Conversion from Operations may be different from the calculation used by other companies, including competitors in the industry, and therefore, the Company’s measures may not be comparable to those of other companies. For further information see "Reconciliations of Non-GAAP Financial Measures”. |
Indebtedness
In May 2022, Vitru Brasil Empreendimentos e Participações (Vitru Brasil), a subsidiary wholly owned by Vitru Ltd., completed the issuance of two series of simple, secured, non-convertible debentures (Brazilian bonds denominated in R$) in an offering with restricted distribution efforts directed solely at professional investors in Brazil. The two series of debentures amounted to R$1.95 billion at interest rates indexed to the CDI (Certificado de Depósito Interbancário) for a five-year term in total, in connection with the business combination with UniCesumar, as follows:
| ◾ | Series 1 Debentures: R$0.5 billion (final maturity on May 15, 2024); and |
| ◾ | Series 2 Debentures: R$1.45 billion (final maturity on May 15, 2027). |
Among our obligations under the indenture governing this issuance, one of the main covenants to which we are subject is to maintain our Net Debt to Adjusted EBITDA ratio ( ) at a figure no greater than the following:
| ◾ | 4.5x in June 2023; |
| ◾ | 4.0x in December 2023; |
| ◾ | 3.5x in June 2024; and |
| ◾ | 3.0x in December 2024. |
1Q23 Results | 14 |
Once the covenant starts to be measured (as from June 2023 onwards), the figures for this calculation will be on an ex-IFRS 16 basis. The following table summarizes our net debt position as of March 31, 2023 and 2022:
Table 10: Net Debt
R$ million | | March 31, | December 31, | March 31, |
Net Debt (ex-IFRS 16)1 | | 2,031.9 | 2,054.0 | (202.6) |
Lease Liabilities | | 321.5 | 323.3 | 166.2 |
Total Net Debt (IFRS 16) | | 2,353.3 | 2,377.4 | (36.4) |
| (1) | Including Loans & financing and Payables from acquisition of subsidiaries. For a reconciliation of Net Debt (ex-IFRS 16), see "—Reconciliations of Non-GAAP Financial Measures—Reconciliation of Net Debt" at the end of this document. |
Furthermore, on May 5, 2023, we announced the issuance by Vitru Brasil of its second secured, non-convertible debentures in an offering with restricted distribution efforts directed solely at professional investors in Brazil. The series of debentures amounted to R$190 million at interest rates indexed to the CDI (Certificado de Depósito Interbancário) for a five-year term in total. The amount raised with this new debentures issuance will be used for extending the Company’s average maturity term in its indebtedness, as well as for general working capital purposes.
CAPEX
Capital Expenditures (CAPEX) in 1Q23 totaled R$19.9 million, an increase of 95.1% compared to the amount spent in 1Q22. This increase was mainly due to the consolidation of UniCesumar capital expenditures into our results, which included investments both in property and equipment and intangible assets, aligned with the expansion of our business.
Given the business combination with UniCesumar, the planned synergies in content production and in the expansion process of Vitru with hubs from both brands are being completed as planned. As a result, CAPEX as a percentage of Net Revenue decreased by 1.2 p.p. in 1Q23 when compared to the same period in 2022. Vitru believes that capital expenditures can be further optimized during the integration of both companies.
Table 11: CAPEX
R$ million |
| 1Q231 | 1Q22 | % Chg |
Property and equipment | | 4.9 | 2.1 | 133.3% |
Intangible assets | | 15.0 | 8.1 | 85.2% |
Investing activities | | 19.9 | 10.2 | 95.1% |
as % of Net Revenue | | 4.5% | 5.7% | (1.2) p.p. |
| (1) | 1Q23 results reflect the consolidation of UniCesumar. |
1Q23 Results | 15 |
ABOUT VITRU (NASDAQ: VTRU)
VITRU is the leading pure-player in the private post-secondary digital education market in Brazil based on the number of enrolled undergraduate students, according to the most recent INEP census released by the Brazilian Ministry of Education (Ministério da Educação), in February 2022.
Vitru has been listed on the Nasdaq stock exchange in the United States (ticker symbol: VTRU) since September 18, 2020, and its mission is to democratize access to education in Brazil through a digital ecosystem and empower every student to create their own successful story.
Through its subsidiaries, Vitru provides a complete pedagogical ecosystem focused on a hybrid distance learning experience for undergraduate and continuing education students. All the academic content is delivered in multiple formats (videos, eBooks, podcasts and html text, among others) through its proprietary Virtual Learning Environment, or VLE. The pedagogical model also incorporates in-person weekly meetings hosted by dedicated tutors who are mostly local working professionals in the subject area they teach. The Company believes that this unique tutor-centric learning experience sets it apart, creating a stronger sense of community and belonging and contributing to higher engagement and retention rates of its student base.
The Company’s results are based on three operating segments:
| ◾ | Digital education undergraduate courses. What differentiates Vitru’s digital education model are the higher quality and its hybrid methodology with synchronous learning, which consists of weekly in-person or online meetings with tutors for Uniasselvi, and weekly online classes for UniCesumar students, alongside the benefit of the virtual learning environment, where students are able to study where and when they prefer. The Company’s portfolio of courses is composed mainly of pedagogy, business administration, accounting, physical education, vocational, engineering, and health-related courses. |
| ◾ | On-campus undergraduate courses. Vitru (through Uniasselvi and UniCesumar) has several campuses that offer traditional on-campus undergraduate courses, including medical, engineering, law, and health-related courses. On-campus students experience a complete learning ecosystem, mixing theory with practical applications as well as access to sports activities and cultural events. |
| ◾ | Continuing education courses. Vitru (through Uniasselvi and UniCesumar) offers continuing education and graduate courses predominantly in pedagogy, finance, and business, but also in other subjects such as law, engineering, IT and health-related courses. Courses are offered in three different versions, consisting of (i) hybrid model, (ii) 100% online, and (iii) on-campus. This also includes technical courses and professional qualification courses. |
FORWARD-LOOKING STATEMENTS
This press release contains forward-looking statements within the meaning of the Private Securities Litigation Reform Act of 1995, which statements involve substantial risks and uncertainties. All statements, other than statements of historical fact, could be deemed forward-looking, including risks and uncertainties related to statements about the proposed business combination, including the benefits of the business combination, integration plans, expected synergies and revenue opportunities, anticipated future financial and operating performance and results, including estimates for growth, the expected management and governance of the combined company, and the expected timing of the business combination; the effect of the COVID-19 outbreak on general economic and business conditions in Brazil and globally, and any restrictive measures imposed by governmental authorities in response to the outbreak; our ability to implement, in a timely and efficient manner, any measure necessary to respond to, or reduce the effects of, the COVID-19 outbreak on our business, operations, cash flow, prospects, liquidity and financial condition; our ability to efficiently predict, and react to, temporary or long-lasting changes in consumer behavior resulting from the COVID-19 outbreak, including after the outbreak has been sufficiently controlled; our competition; our ability to implement our business strategy; our ability to adapt to
1Q23 Results | 16 |
technological changes in the educational sector; the availability of government authorizations on terms and conditions and within periods acceptable to us; our ability to continue attracting and retaining new students; our ability to maintain the academic quality of our programs; our ability to maintain the relationships with our hub partners; our ability to collect tuition fees; the availability of qualified personnel and the ability to retain such personnel; changes in government regulations applicable to the education industry in Brazil; government interventions in education industry programs, which affect the economic or tax regime, the collection of tuition fees or the regulatory framework applicable to educational institutions; a decline in the number of students enrolled in our programs or the amount of tuition we can charge; our ability to compete and conduct our business in the future; the success of operating initiatives, including advertising and promotional efforts and new product, service and concept development by us and our competitors; changes in consumer demands and preferences and technological advances, and our ability to innovate to respond to such changes; changes in labor, distribution and other operating costs; our compliance with, and changes to, government laws, regulations and tax matters that currently apply to us; general market, political, economic and business conditions; and our financial targets. Forward-looking statements by their nature address matters that are, to different degrees, uncertain, such as statements about the potential effects of the COVID-19 pandemic on our business operations, financial results and financial position and on the Brazilian economy.
The forward-looking statements can be identified, in certain cases, through the use of words such as "believe,” "may,” "might,” "can,” "could,” "is designed to,” "will,” "aim,” "estimate,” "continue,” "anticipate,” "intend,” "expect,” "forecast,” "plan,” "predict,” "potential,” "aspiration,” "should,” "purpose,” "belief,” and similar, or variations of, or the negative of, such words and expressions. Forward-looking statements speak only as of the date they are made, and the Company does not undertake any obligation to update them in light of new information or future developments or to release publicly any revisions to these statements in order to reflect later events or circumstances or to reflect the occurrence of unanticipated events. The achievement or success of the matters covered by such forward-looking statements involves known and unknown risks, uncertainties and assumptions. If any such risks or uncertainties materialize or if any of the assumptions prove incorrect, our results could differ materially from the results expressed or implied by the forward-looking statements we make. Readers should not rely upon forward-looking statements as predictions of future events. Forward-looking statements represent management’s beliefs and assumptions only as of the date such statements are made. Further information on these and other factors that could affect the Company’s financial results is included in filings made with the U.S. Securities and Exchange Commission ("SEC”) from time to time, including the section titled "Item 3. Key Information—D. Risk Factors” in the most recent Annual Report on Form 20-F of the Company. These documents are available on the SEC Filings section of the investor relations section of our website at investors.vitru.com.br.
NON-GAAP FINANCIAL MEASURES
To supplement the Company’s consolidated financial statements, which are prepared and presented in accordance with International Financial Reporting Standards as issued by the International Accounting Standards Board—IASB, VITRU uses Adjusted EBITDA, Adjusted Net Income, Adjusted Cash Flow Conversion from Operations information, and Net Debt which are non-GAAP financial measures, for the convenience of the investment community. A non-GAAP financial measure is generally defined as one that purports to measure financial performance but excludes or includes amounts that would not be so adjusted in the most comparable GAAP measure.
VITRU calculates Adjusted EBITDA as the net income (loss) for the period plus:
| ◾ | deferred and current income tax, which is calculated based on income, adjusted based on certain additions and exclusions provided for in applicable legislation. The income taxes in Brazil consist of corporate income tax (Imposto de Renda Pessoa Jurídica), or IRPJ, and CSLL, which are social contribution taxes; |
| ◾ | financial results, which consist of interest expenses less interest income; |
| ◾ | depreciation and amortization; |
1Q23 Results | 17 |
| ◾ | interest on tuition fees paid in arrears, which refers to interest received from students on late payments of monthly tuition fees and which is added back; |
| ◾ | impairment of non-current assets, which consists of impairment charges associated with the on-campus undergraduate courses segment, given the deterioration in the prospects of this business; |
| ◾ | share-based compensation plan, which consists of non-cash expenses related to the grant of share-based compensation, as well as fair value adjustments for share-based compensation expenses classified as a liability in the consolidated financial statements; |
| ◾ | other income (expenses), net, which consists of other expenses such as contractual indemnities and deductible donations among others; and |
| ◾ | M&A, pre-offering expenses and restructuring expenses, which consists of adjustments that the Company believes are appropriate to provide additional information to investors about certain material non-recurring items. Such M&A, pre-offering expenses and restructuring expenses comprise: mergers and acquisitions, or M&A, and pre-offering expenses, which are expenses related to mergers, acquisitions and divestments (including due diligence, transaction and integration costs), as well as the expenses related to the preparation of offerings; and restructuring expenses, which refers to expenses related to employee severance costs in connection with organizational and academic restructurings. |
VITRU calculates Adjusted Net Income as net income (loss) for the period plus:
| ◾ | share-based compensation plan, as defined above; |
| ◾ | M&A, pre-offering expenses, and restructuring expenses, as defined above; |
| ◾ | impairment of non-current assets, as defined above; |
| ◾ | amortization of intangible assets recognized as a result of business combinations, which refers to the amortization of the following intangible assets from business combinations: software, trademark, distance learning operation licenses, non-compete agreements, customer relationship, teaching-learning material, licenses to operate medical courses, and leasing contracts. For more information, see notes to the unaudited interim condensed consolidated financial statements in the Company’s filings with the U.S. Securities and Exchange Commission; |
| ◾ | interest accrued at the original effective interest rate (excluding restatement as a result of inflation) on the accounts payable from the acquisition of subsidiaries. See notes to the unaudited interim condensed consolidated financial statements in the Company’s filings with the U.S. Securities and Exchange Commission; and |
| ◾ | corresponding tax effects on adjustments, which represents the tax effect of pre-tax items excluded from adjusted net income (loss). The tax effect of pre-tax items excluded from adjusted net income (loss) is computed using the statutory rate related to the jurisdiction that was affected by the adjustment after taking into account the effect of permanent differences and valuation allowances. |
VITRU calculates Adjusted Cash Flow Conversion from Operations as adjusted cash flow from operations (which is calculated as cash from operations plus income tax paid) divided by Adjusted EBITDA (as defined above but without taking M&A, pre-offering expenses, and restructuring expenses into consideration).
VITRU calculates Net Debt (ex-IFRS 16) as the sum of loans and financing, payables from acquisition of subsidiaries, and lease liabilities less cash and cash equivalents and short-term investments.
Adjusted EBITDA, Adjusted Net Income, Adjusted Cash Flow Conversion from Operations, and Net Debt are the key performance indicators used by Vitru to measure the financial performance and condition of its core operations, and Vitru believes that these measures facilitate period-to-period comparisons on a consistent basis. As a result, its management believes that these non-GAAP financial measures provide useful information to the investment community. These summarized, non-audited, or non-GAAP financial measures are in addition to, and not a substitute for, or superior to, measures of financial performance prepared in accordance with IFRS. Additionally, the calculations of Adjusted EBITDA, Adjusted Net Income, Adjusted Cash Flow Conversion from Operations, and Net Debt may be different from the calculations used by other companies, including competitors in the education services industry, and therefore, Vitru’s measures may not be comparable to those of other companies. For a reconciliation of Adjusted EBITDA, Adjusted Net Income, Adjusted Cash Flow Conversion from Operations, and Net Debt to the most directly comparable IFRS measure, see the tables at the end of this document.
1Q23 Results | 18 |
FINANCIAL TABLES
Unaudited interim condensed consolidated statements of profit or loss and other comprehensive income for the three-month period ended March 31, 2023 and 2022
| | Three Months Ended March 31, | |
R$ million (except earnings per share) |
| 2023 | 2022 |
| | | |
NET REVENUE | | 444.2 | 177.8 |
| | | |
Cost of services rendered | | (151.3) | (65.1) |
| | | |
GROSS PROFIT | | 293.0 | 112.7 |
| | | |
General and administrative expenses | | (54.4) | (13.8) |
Selling expenses | | (90.1) | (48.0) |
Net impairment losses on financial assets | | (47.7) | (25.7) |
Other income (expenses), net | | 0.3 | 0.3 |
Operating expenses | | (191.9) | (87.2) |
| | | |
OPERATING PROFIT | | 101.1 | 25.5 |
| | | |
Financial income | | 11.5 | 15.0 |
Financial expenses | | (86.0) | (14.0) |
Financial results | | (74.5) | 1.0 |
| | | |
PROFIT BEFORE TAXES | | 26.6 | 26.5 |
| | | |
Current income taxes | | (4.1) | (2.9) |
Deferred income taxes | | 33.7 | 0.4 |
Income taxes | | 29.6 | (2.5) |
| | | |
NET INCOME FOR THE PERIOD | | 56.2 | 24.0 |
| | | |
TOTAL COMPREHENSIVE INCOME | | 56.2 | 24.0 |
| | | |
Basic earnings per share (R$) | | 1.67 | 1.04 |
Diluted earnings per share (R$) | | 1.57 | 0.98 |
1Q23 Results | 19 |
Unaudited interim condensed consolidated statements of financial position as of March 31, 2023 and December 31, 2022
| | March 31, | December 31, |
R$ million | | 2023 | 2022 |
ASSETS | | |
|
| | | |
CURRENT ASSETS | | | |
| | | |
Cash and cash equivalents | | 16.0 | 47.2 |
Short-term investments | | 150.6 | 26.4 |
Trade receivables | | 238.9 | 224.1 |
Income taxes recoverable | | 6.1 | 7.0 |
Prepaid expenses | | 29.1 | 20.0 |
Receivables from hub partners | | 42.4 | 32.0 |
Other current assets | | 10.7 | 14.9 |
| | | |
TOTAL CURRENT ASSETS | | 493.8 | 371.5 |
| | | |
NON-CURRENT ASSETS | | | |
| | | |
Trade receivables | | 44.1 | 47.0 |
Indemnification assets | | 10.6 | 9.9 |
Deferred tax assets | | 226.1 | 203.0 |
Receivables from hub partners | | 53.0 | 48.1 |
Other non-current assets | | 1.8 | 6.9 |
Right-of-use assets | | 346.6 | 350.4 |
Property and equipment | | 191.8 | 194.6 |
Intangible assets | | 4,405.7 | 4,427.6 |
| | | |
TOTAL NON-CURRENT ASSETS | | 5,279.7 | 5,287.5 |
| | | |
TOTAL ASSETS | | 5,773.5 | 5,659.1 |
1Q23 Results | 20 |
| | March 31, | December 31, |
R$ million | | 2023 | 2022 |
LIABILITIES | | | |
| | | |
CURRENT LIABILITIES | | | |
| | | |
Trade payables | | 71.7 | 99.7 |
Loans and financing | | 187.0 | 131.2 |
Lease liabilities | | 50.5 | 51.3 |
Labor and social obligations | | 55.0 | 43.1 |
Taxes payable | | 13.4 | 16.0 |
Prepayments from customers | | 52.9 | 43.6 |
Other current liabilities | | 4.2 | 7.5 |
| | | |
TOTAL CURRENT LIABILITIES | | 434.7 | 392.4 |
| | | |
NON-CURRENT | | | |
| | | |
Lease liabilities | | 271.0 | 272.0 |
Loans and financing | | 1,492.0 | 1,489.1 |
Share-based compensation | | 15.9 | 19.8 |
Payables from acquisition of subsidiaries | | 519.6 | 507.4 |
Provisions for contingencies | | 32.3 | 29.2 |
Deferred tax liabilities | | 762.8 | 773.4 |
Other non-current liabilities | | 3.8 | 1.5 |
| | | |
TOTAL NON-CURRENT LIABILITIES | | 3,097.4 | 3,092.3 |
| | | |
TOTAL LIABILITIES | | 3,532.1 | 3,484.7 |
| | | |
EQUITY | | | |
| | | |
Share capital | | 0.008 | 0.008 |
Capital reserves | | 2,057.2 | 2,054.5 |
Retained earnings | | 176.1 | 119.9 |
| | | |
TOTAL EQUITY | | 2,233.2 | 2,174.4 |
| | | |
TOTAL LIABILITIES AND EQUITY | | 5,765.3 | 5,659.1 |
1Q23 Results | 21 |
Unaudited interim condensed consolidated statements of cash flows for the three-month period ended March 31, 2023 and 2022
| | Three Months Ended March 31, | |
R$ million |
| 2023 | 2022 |
Cash flows from operating activities | | | |
Profit before taxes | | 26.6 | 26.4 |
Adjustments to reconcile income before taxes to cash provided on operating activities | | | |
Depreciation and amortization | | 52.3 | 14.9 |
Net impairment losses on financial assets | | 47.7 | 25.7 |
Provision for revenue cancellation | | 0.3 | 0.2 |
Provision for contingencies | | 2.4 | 0.7 |
Accrued interests | | 79.3 | (5.6) |
Exchange variation | | (0.4) | - |
Share-based compensation | | 0.1 | (5.5) |
Modification of lease contracts | | (0.6) | (0.3) |
Loss on sale or disposal of non-current assets | | 0.04 | - |
Changes in operating assets and liabilities | | | |
Trade receivables | | (59.8) | (31.7) |
Prepayments | | (1.8) | (0.4) |
Other assets | | (4.5) | (0.0) |
Trade payables | | (28.0) | 19.3 |
Labor and social obligations | | 11.9 | 4.7 |
Other taxes payable | | (2.6) | 0.4 |
Prepayments from customers | | 9.3 | 2.0 |
Other payables | | (0.9) | 0.1 |
Cash from operations | | 131.2 | 50.7 |
| | | |
Income tax paid | | (3.1) | (3.8) |
Interest paid | | (8.4) | (4.1) |
Contingencies paid | | (1.5) | (1.1) |
Net cash provided by operating activities | | 118.1 | 41.6 |
| | | |
Cash flows from investing activities | | | |
Purchase of property and equipment | | (4.9) | (2.1) |
Purchase and capitalization of intangible assets | | (15.0) | (8.1) |
Payments for the acquisition of interests in subsidiaries, net of cash | | - | (1.3) |
Acquisition of short-term investments, net | | (124.2) | 1.4 |
Net cash used in investing activities | | (144.1) | (10.1) |
| | | |
Cash flows from financing activities | | | |
Payments of lease liabilities | | (5.2) | (3.6) |
Costs related to issuances | | - | (7.3) |
Capital contributions | | - | 0.6 |
Net cash provided by (used in) financing activities | | (5.2) | (10.3) |
| | | |
Net increase in cash and cash equivalents | | (31.2) | 21.2 |
Cash and cash equivalents at the beginning of the period | | 47.2 | 75.6 |
Cash and cash equivalents at the end of the period | | 16.0 | 96.8 |
1Q23 Results | 22 |
Reconciliations of Non-GAAP Financial Measures
Reconciliation of Adjusted EBITDA
| | Three Months Ended March 31, | |
R$ million |
| 2023 | 2022 |
Net income for the period | | 56.2 | 24.0 |
(+) Deferred and current income tax | | (29.6) | 2.5 |
(+) Financial result | | 74.5 | (1.0) |
(+) Depreciation and amortization | | 52.3 | 14.9 |
(+) Interest on tuition fees paid in arrears | | 7.2 | 5.9 |
(+) Share-based compensation plan | | 0.1 | (5.5) |
(+) Other income (expenses), net | | (0.3) | (0.3) |
(+) M&A, pre-offering expenses and restructuring expenses | | 8.1 | 6.9 |
Adjusted EBITDA | | 168.5 | 47.4 |
Reconciliation of Adjusted Net Income
| | Three Months Ended March 31, | |
R$ million | | 2023 | 2022 |
Net income for the period | | 56.2 | 24.0 |
(+) M&A, pre-offering expenses and restructuring expenses | | 8.1 | 6.9 |
(+) Share-based compensation plan | | 0.1 | (5.5) |
(+) Amortization of intangible assets from business combinations | | 31.2 | 0.9 |
(+) Interest accrued on accounts payable from the acquisition of subsidiaries | | (1.2) | 1.0 |
(-) Corresponding tax effects on adjustments | | (13.4) | (0.8) |
Adjusted Net Income | | 81.1 | 26.5 |
Reconciliation of Adjusted Cash Flow Conversion from Operations
| | Three Months Ended March 31, | |
R$ million | | 2023 | 2022 |
Cash from Operations | | 131.2 | 50.7 |
(+) Income tax paid | | (3.1) | (3.8) |
Adjusted Cash Flow from Operations | | 128.0 | 46.9 |
| | | |
Adjusted EBITDA | | 168.5 | 47.4 |
(-) M&A, pre-offering expenses and restructuring expenses | | (8.1) | (6.9) |
Adjusted EBITDA excluding M&A, pre-offering expenses and restructuring expenses | | 160.4 | 40.5 |
| | | |
Adjusted Cash Flow Conversion from Operations | | 79.8% | 115.8% |
1Q23 Results | 23 |
Reconciliation of M&A, Pre-offering and Restructuring Expenses
R$ million |
| 1Q23 | 1Q22 | % Chg |
Integration UniCesumar (pre- and post-closing) | | 4.5 | 4.0 | 12.8% |
UniCesumar earn-out payments (accounted as expenses) | | - | - | n.a. |
Other M&A expenses (including advisors' fees) | | 1.1 | 0.5 | 110.5% |
Others | | 2.5 | 2.3 | 7.3% |
Total M&A, pre-offering expenses and restructuring expenses | | 8.1 | 6.9 | 18.6% |
Reconciliation of Net Debt
R$ million | | March 31, | December 31, | March 31, |
Net Debt (ex-IFRS 16) | | 2,031.9 | 2,054.0 | (202.6) |
Loans and financing | | 1,679.0 | 1,620.2 | - |
Payables from acquisition of subsidiaries | | 519.6 | 507.4 | 153.6 |
(-) Cash and cash equivalents | | (16.0) | (47.2) | (96.8) |
(-) Short-term investments | | (150.6) | (26.4) | (259.4) |
Lease Liabilities | | 321.5 | 323.3 | 166.2 |
Total Net Debt (IFRS 16) | | 2,353.3 | 2,377.4 | (36.4) |
1Q23 Results | 24 |