UNITED STATES
SECURITIES AND EXCHANGE COMMISSION
Washington, D.C. 20549
FORM 8-K
CURRENT REPORT
Pursuant to Section 13 or 15(d) of the
Securities Exchange Act of 1934
Date of report (Date of earliest event reported): November 20, 2019
AdaptHealth Corp.
(Exact name of registrant as specified in charter)
|
Delaware |
|
001-38399 |
|
82-3677704 |
220 West Germantown Pike, Suite 250
Plymouth Meeting, PA
(Address of principal executive offices)
19462
(Zip Code)
(610) 630-6357
(Registrant’s telephone number, including area code)
(Former name or former address, if changed since last report)
Check the appropriate box below if the Form 8-K is intended to simultaneously satisfy the filing obligation of the Registrant under any of the following provisions:
o Written communications pursuant to Rule 425 under the Securities Act (17 CFR 230.425)
o Soliciting material pursuant to Rule 14a-12 under the Exchange Act (17 CFR 240.14a-12)
o Pre-commencement communications pursuant to Rule 14d-2(b) under the Exchange Act (17 CFR 240.14d-2(b))
o Pre-commencement communications pursuant to Rule 13e-4(c) under the Exchange Act (17 CFR 240.13e-4(c))
Securities registered pursuant to Section 12(b) of the Act:
|
Title of each class |
|
Trading Symbol(s) |
|
Name of each exchange on which registered |
|
Class A Common Stock, par value $0.0001 per share |
|
AHCO |
|
The Nasdaq Stock Market LLC |
|
Warrants, each whole warrant exercisable for one share of Class A Common Stock at an exercise price of $11.50 |
|
AHCOW |
|
The Nasdaq Stock Market LLC |
Indicate by check mark whether the registrant is an emerging growth company as defined in Rule 405 of the Securities Act of 1933 (§ 230.405) or Rule 12b-2 of the Securities Exchange Act of 1934 (§ 240.12b-2).
Emerging growth company x
If an emerging growth company, indicate by check mark if the registrant has elected not to use the extended transition period for complying with any new or revised financial accounting standards provided pursuant to Section 13(a) of the Exchange Act. o
Item 7.01. Regulation FD Disclosure
On November 20, 2019, AdaptHealth Corp., a Delaware corporation (the “Company”), made available on its website at www.adapthealth.com a presentation relating to the Company’s business and operations that, among other things, updates information concerning the Company. A copy of the investor presentation, is attached hereto as Exhibit 99.1 and incorporated herein by reference. Such exhibit and the information set forth therein shall not be deemed to be filed for purposes of Section 18 of the Securities Exchange Act of 1934, as amended (the “Exchange Act”), or otherwise be subject to the liabilities of that section, nor shall it be deemed to be incorporated by reference in any filing under the Securities Act of 1933, as amended (the “Securities Act”), or the Exchange Act.
Forward-looking Statements
Certain statements in this Current Report on Form 8-K may constitute “forward-looking statements” for purposes of the federal securities laws. Our forward-looking statements include, but are not limited to, statements regarding our or our management team’s expectations, hopes, beliefs, intentions or strategies regarding the future. In addition, any statements that refer to projections, forecasts or other characterizations of future events or circumstances, including any underlying assumptions, are forward-looking statements. The words “anticipate,” “believe,” “continue,” “could,” “estimate,” “expect,” “intends,” “may,” “might,” “plan,” “possible,” “potential,” “predict,” “project,” “should,” “would” and similar expressions may identify forward-looking statements, but the absence of these words does not mean that a statement is not forward-looking.
These forward-looking statements are based on information available as of the date of this Current Report on Form 8-K, and current expectations, forecasts and assumptions, and involve a number of judgments, risks and uncertainties. Accordingly, forward-looking statements should not be relied upon as representing our views as of any subsequent date, and we do not undertake any obligation to update forward-looking statements to reflect events or circumstances after the date they were made, whether as a result of new information, future events or otherwise, except as may be required under applicable securities laws.
As a result of a number of known and unknown risks and uncertainties, our actual results or performance may be materially different from those expressed or implied by these forward-looking statements. A further description of such risks and uncertainties can be found in the Company’s filings with the Securities and Exchange Commission, including the Company’s definitive proxy statement in connection with the solicitation of proxies from its stockholders filed with the Securities and Exchange Commission on October 23, 2019.
Item 9.01. Financial Statements and Exhibits.
(d) Exhibits.
|
Exhibit No. |
|
Exhibit |
|
99.1 |
|
SIGNATURE
Pursuant to the requirements of the Securities Exchange Act of 1934, the registrant has duly caused this report to be signed on its behalf by the undersigned, hereunto duly authorized.
Dated: November 20, 2019
|
|
AdaptHealth Corp. | |
|
|
|
|
|
|
|
|
|
|
By: |
/s/ Gregg Holst |
|
|
|
Name: Gregg Holst |
|
|
|
Title: Chief Financial Officer |

Disclaimer Disclaimers and Other Important Information This presentation (this “Presentation”) is for informational purposes only and has been prepared to assist interested parties in making their own evaluation with respect to a potential investment in AdaptHealth Corp. (“AdaptHealth” or the “Company”) and for no other purpose. The information contained in this Presentation does not purport to be all inclusive. The data contained herein is derived from various internal and external sources. The information contained in this Presentation is not, and should not be assumed to be, complete and does not present all the information that investors may require or desire in considering an investment in the Company. It is not intended to form the basis of any investment decision or any other decision in respect of the Company. AdaptHealth (as well as its respective directors, officers and stockholders) makes, and each of hereby expressly disclaims, any representations or warranties, express or implied, as to the reasonableness of the assumptions made in this Presentation or the accuracy or completeness of any projections or modeling or any other information contained in this Presentation. AdaptHealth shall have any liability for any representations, express or implied, contained in, or omissions from, this Presentation or any other written or oral communication communicated to the recipient in the course of the recipient’s evaluation of AdaptHealth. Nothing contained within this Presentation is or should be relied upon as a promise or representation as to the future. AdaptHealth does not assume any obligation to provide the recipient with access to any additional information or to update the information in this Presentation. Investors should not construe the contents of this Presentation, or any prior or subsequent communications from or with the Company or its representatives as investment, legal or tax advice. No securities commission or securities regulatory authority or other authority in the United States or any other jurisdiction has in any way passed upon the merits of a potential investment in AdaptHealth or the accuracy or adequacy of this Presentation. Forward Looking Statements This Presentation includes certain statements that are not historical facts but are forward-looking statements for purposes of the safe harbor provisions under the United States Private Securities Litigation Reform Act of 1995. Forward-looking statements generally are accompanied by words such as “believe,” “may,” “will,” “estimate,” “continue,” “anticipate,” “intend,” “expect,” “should,” “would,” “plan,” “predict,” “potential,” “seem,” “seek,” “future,” “outlook,” and similar expressions that predict or indicate future events or trends or that are not statements of historical matters. These forward-looking statements include, but are not limited to, statements regarding projections, estimates and forecasts of revenue and other financial and performance metrics and projections of market opportunity and expectations. These statements are based on various assumptions and on the current expectations of AdaptHealth management and are not predictions of actual performance. These forward-looking statements are provided for illustrative purposes only and are not intended to serve as, and must not be relied on, by any investor as, a guarantee, an assurance, a prediction or a definitive statement of fact or probability. Actual events and circumstances are difficult or impossible to predict and will differ from assumptions. Many actual events and circumstances are beyond the control of AdaptHealth These forward-looking statements are subject to a number of risks and uncertainties, including the outcome of judicial and administrative proceedings to which AdaptHealth may become a party or governmental investigations to which AdaptHealth may become subject that could interrupt or limit AdaptHealth’s operations, result in adverse judgments, settlements or fines and create negative publicity; changes in AdaptHealth’s clients’ preferences, prospects and the competitive conditions prevailing in the healthcare sector. Important factors that could cause or contribute to such risks and uncertainties are discussed in AdaptHealth’s filings with the U.S. Securities and Exchange Commission. If the risks materialize or assumptions prove incorrect, actual results could differ materially from the results implied by these forward-looking statements. There may be additional risks that AdaptHealth presently knows or that AdaptHealth currently believes is immaterial that could also cause actual results to differ from those contained in the forward-looking statements. In addition, forward-looking statements reflect AdaptHealth’s expectations, plans or forecasts of future events and views as of the date of this press release. AdaptHealth anticipates that subsequent events and developments will cause AdaptHealth’s assessments to change. However, while AdaptHealth may elect to update these forward-looking statements at some point in the future, AdaptHealth specifically disclaims any obligation to do so. These forward-looking statements should not be relied upon as representing AdaptHealth’s assessments as of any date subsequent to the date of this press release. Accordingly, undue reliance should not be placed upon the forward-looking statements. Market and Industry Data Industry and market data used in this Presentation is unaudited and have been obtained from third-party industry publications and sources as well as from research reports prepared for other purposes. AdaptHealth has not independently verified the data obtained from these sources and cannot assure you of the data’s accuracy or completeness. This data is subject to change and cannot always be verified with complete certainty due to limits on the availability and reliability of raw data, the voluntary nature of the data gathering process and other limitations and uncertainties inherent in any statistical survey of market or industry data. You are cautioned not to give undue weight to such industry and market data. Non-GAAP and Other Financial Information The financial information contained in this Presentation has not been prepared with a view toward compliance with rules of the SEC applicable to disclosures by SEC reporting companies generally or with a view toward compliance with the SEC’s rules relating to non-GAAP financial information. This Presentation includes references to financial measures that are calculated and presented on the basis of methodologies other than in accordance with generally accepted accounting principles in the United States of America (“GAAP”), including the measures EBITDA, Adjusted EBITDA, and Adjusted EBITDA – Patient Capital Expenditures. A reconciliation of certain of these non-GAAP financial measures to the nearest GAAP measure can be found in the Appendix to this Presentation. Any non-GAAP financial measures used in this Presentation are in addition to, and not meant to be considered superior to, or a substitute for, the Company’s financial statements prepared in accordance with GAAP. The principal limitation of these non-GAAP financial measures is that they exclude significant expenses and income that are required by GAAP to be recorded in the Company’s financial statements. In addition, they are subject to inherent limitations as they reflect the exercise of judgments by management about which expense and income are excluded or included in determining these non-GAAP financial measures. The non-GAAP measures presented herein may not be comparable to similar non-GAAP measures presented by other companies. Accordingly, such information and data may not be included in, maybe be adjusted in or may be presented differently in DFB’s proxy statement to be filed by DFB with the SEC. No Offer or Solicitation This Presentation and any oral statements made in connection with this Presentation do not constitute an offer to sell, or a solicitation of an offer to buy, or a recommendation to purchase, any securities in any jurisdiction, or the solicitation of any proxy, vote, consent or approval in any jurisdiction, nor shall there be any sale, issuance or transfer of any securities in any jurisdiction where, or to any person to whom, such offer, solicitation or sale may be unlawful under the laws of such jurisdiction. No offer of securities shall be made except by means of a prospectus meeting the requirements of Section 10 of the Securities Act of 1933, as amended. / Investor Presentation/ November 2019 Page 2
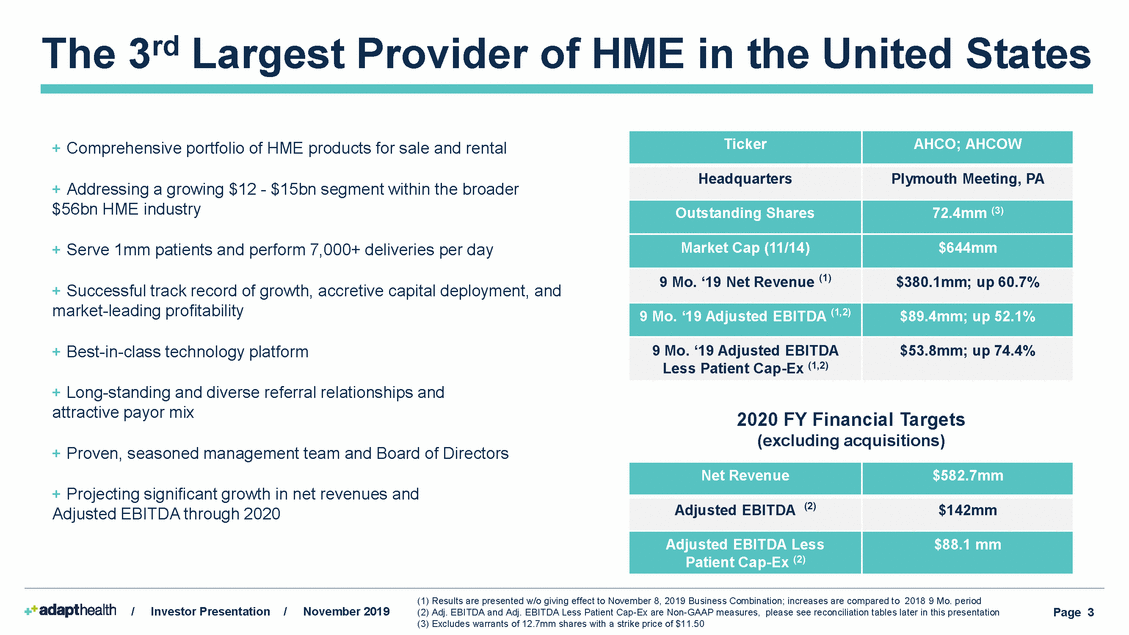
3rd The Largest Provider of HME in the United States + Comprehensive portfolio of HME products for sale and rental + Addressing a growing $12 - $15bn segment within the broader $56bn HME industry + Serve 1mm patients and perform 7,000+ deliveries per day 9 Mo. ‘19 Net Revenue + Successful track record of growth, accretive capital deployment, and market-leading profitability + Best-in-class technology platform + Long-standing and diverse referral relationships and attractive payor mix 2020 FY Financial Targets (excluding acquisitions) + Proven, seasoned management team and Board of Directors + Projecting significant growth in net revenues and Adjusted EBITDA through 2020 (1) Results are presented w/o giving effect to November 8, 2019 Business Combination; increases are compared to 2018 9 Mo. period (2) Adj. EBITDA and Adj. EBITDA Less Patient Cap-Ex are Non-GAAP measures, please see reconciliation tables later in this presentation (3) Excludes warrants of 12.7mm shares with a strike price of $11.50 / Investor Presentation/ November 2019 Page 3 Net Revenue $582.7mm Adjusted EBITDA (2) $142mm Adjusted EBITDA Less Patient Cap-Ex (2) $88.1 mm Ticker AHCO; AHCOW Headquarters Plymouth Meeting, PA Outstanding Shares 72.4mm (3) Market Cap (11/14) $644mm (1) $380.1mm; up 60.7% 9 Mo. ‘19 Adjusted EBITDA (1,2) $89.4mm; up 52.1% 9 Mo. ‘19 Adjusted EBITDA Less Patient Cap-Ex (1,2) $53.8mm; up 74.4%
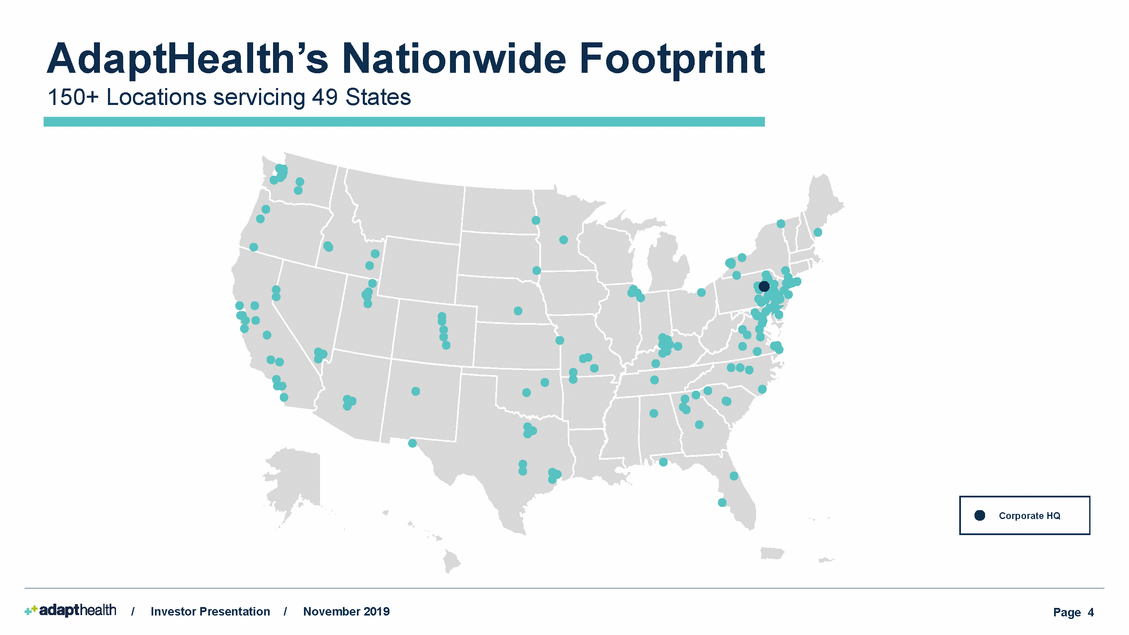
AdaptHealth's Nationwide Footprint 150+ Locations servicing 49 States e Corporate HQ - • ++adapthealthI Investor Presentation I November 2019 Page 4
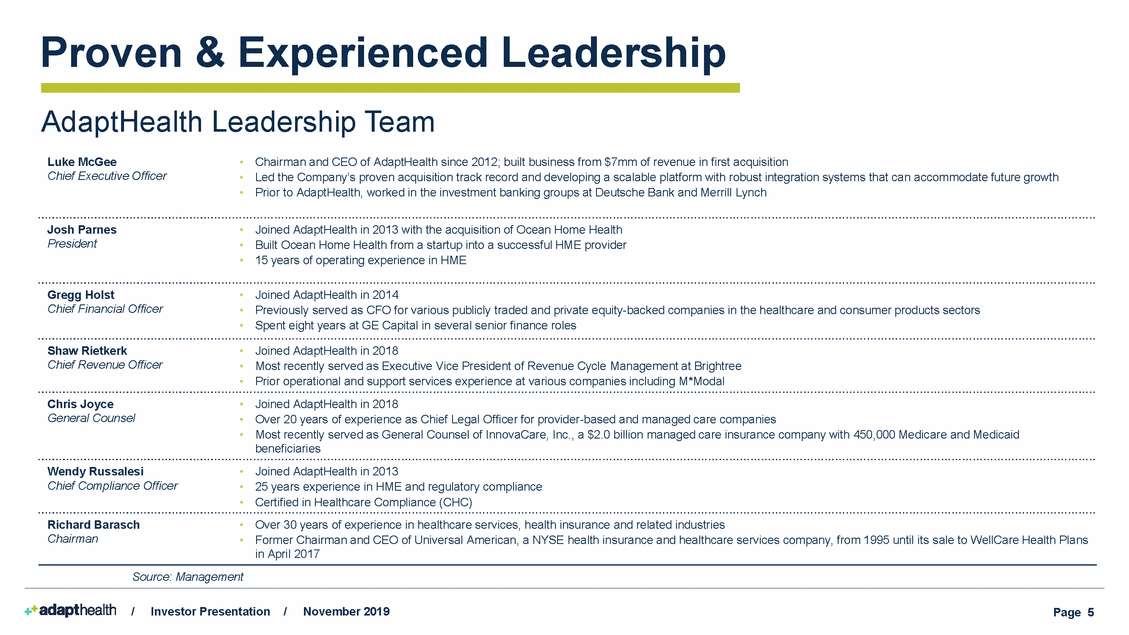
Proven &Experienced Leadership AdaptHealth Leadership Team Luke McGee Chief Executive Officer • • • Chairman and CEO of AdaptHealth since 2012; built business from $7mm of revenue in first acquisition Led the Company’s proven acquisition track record and developing a scalable platform with robust integration systems that can accommodate future growth Prior to AdaptHealth, worked in the investment banking groups at Deutsche Bank and Merrill Lynch Josh Parnes President • • • Joined AdaptHealth in 2013 with the acquisition of Ocean Home Health Built Ocean Home Health from a startup into a successful HME provider 15 years of operating experience in HME Gregg Holst Chief Financial Officer • • • Joined AdaptHealth in 2014 Previously served as CFO for various publicly traded and private equity-backed companies in the healthcare and consumer products sectors Spent eight years at GE Capital in several senior finance roles Shaw Rietkerk Chief Revenue Officer • • • Joined AdaptHealth in 2018 Most recently served as Executive Vice President of Revenue Cycle Management at Brightree Prior operational and support services experience at various companies including M*Modal Chris Joyce General Counsel • • • Joined AdaptHealth in 2018 Over 20 years of experience as Chief Legal Officer for provider-based and managed care companies Most recently served as General Counsel of InnovaCare, Inc., a $2.0 billion managed care insurance company with 450,000 Medicare and Medicaid beneficiaries Wendy Russalesi Chief Compliance Officer • • • Joined AdaptHealth in 2013 25 years experience in HME and regulatory compliance Certified in Healthcare Compliance (CHC) Richard Barasch Chairman • • Over 30 years of experience in healthcare services, health insurance and related industries Former Chairman and CEO of Universal American, a NYSE health insurance and healthcare services company, from 1995 until its sale to WellCare Health Plans in April 2017 Source: Management / Investor Presentation/ November 2019 Page 5
HMEIsCritical ToServing Patients AtHome Industry provides a strategic entry point to patients in the home Why is HME critical to home care? What is HME? Provides for greater patient independence and better outcomes Addresses large, growing medical issues High-touch model creates trusted patient relationships Complete solution for high-frequency home care / Investor Presentation / November 2019 Page 6 + Strategically valuable channel to chronically ill homecare patients + + + + Includes products such as oxygen equipment, CPAP, wheelchairs, hospital beds, bathroom aids, and rehabilitation equipment + + Primarily serve patients with need for respiratory and/or mobility equipment + Enables patients with complex conditions to transition to their preferred home setting + HME service providers deliver critical medical equipment into a patient’s home

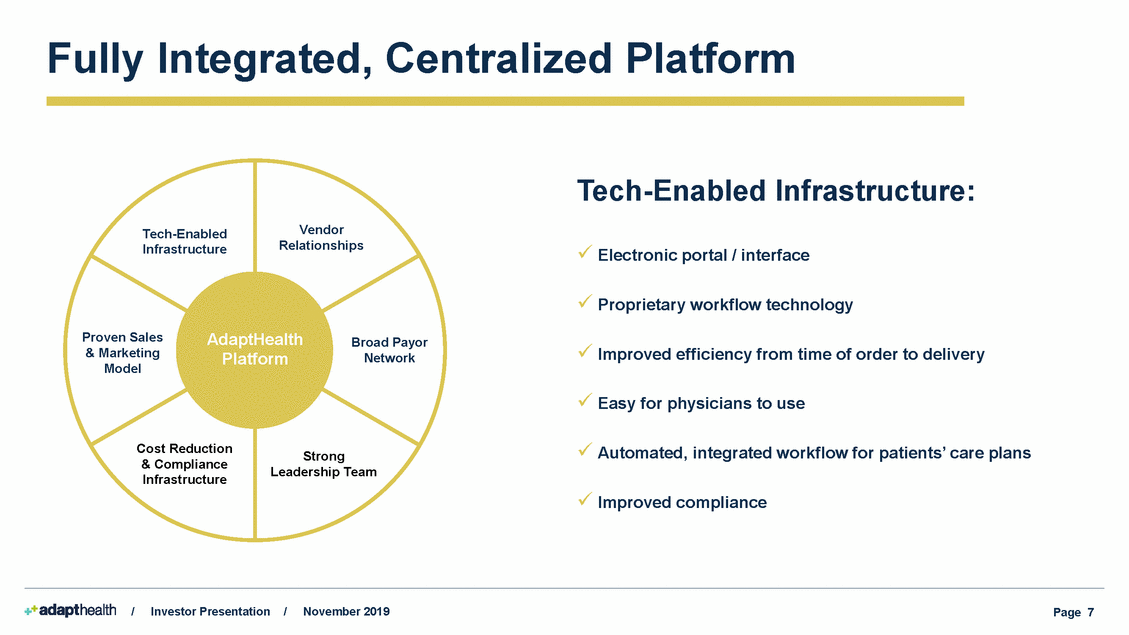
FullyIntegrated, Centralized Platform Tech-Enabled Infrastructure: Vendor Relationships Tech-Enabled Infrastructure Electronic portal / interface Proprietary workflow technology Proven Sales & Marketing Model AdaptHealth Platform Broad Payor Network Improved efficiency from time of order to delivery Easy for physicians to use Cost Reduction & Compliance Infrastructure Automated, integrated workflow for patients’ care plans Strong Leadership Team Improved compliance / Investor Presentation/ November 2019 Page 7
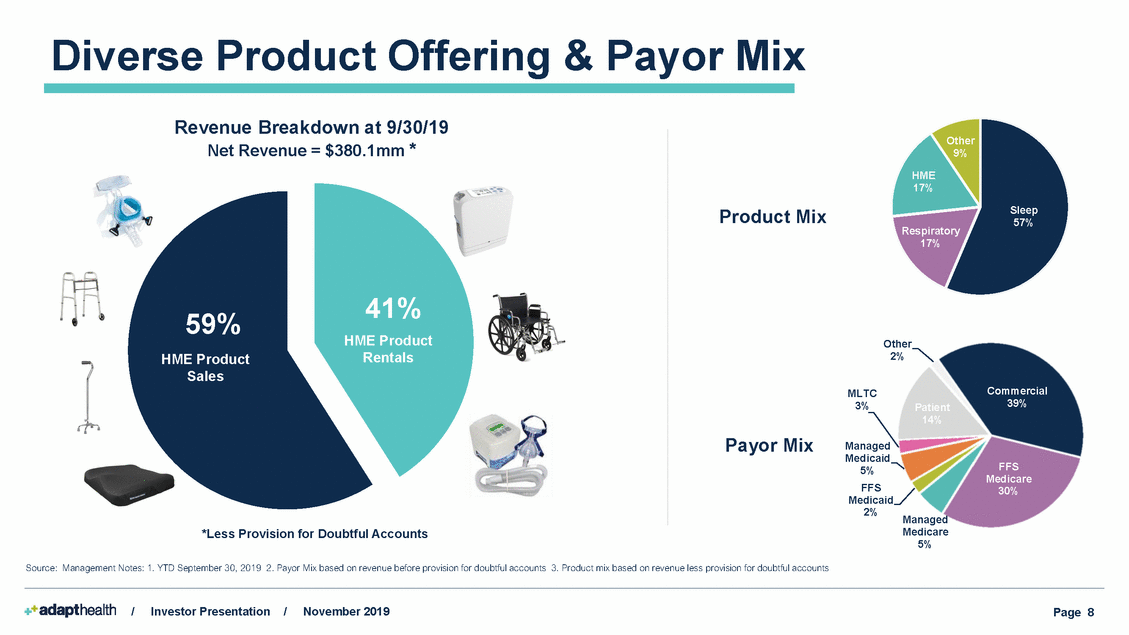
Diverse ProductOffering & Payor Mix Revenue Breakdown at 9/30/19 Net Revenue = $380.1mm * Other 9% HME 17% Sleep 57% Product Mix Respiratory 17% 41% HME Product Rentals 59% HME Product Sales Other 2% Commercial 39% MLTC 3% Patient 14% Payor Mix Managed Medicaid 5% FFS Medicaid 2% FFS Medicare 30% Managed Medicare 5% *Less Provision for Doubtful Accounts Source: Management Notes: 1. YTD September 30, 2019 2. Payor Mix based on revenue before provision for doubtful accounts 3. Product mix based on revenue less provision for doubtful accounts / Investor Presentation/ November 2019 Page 8
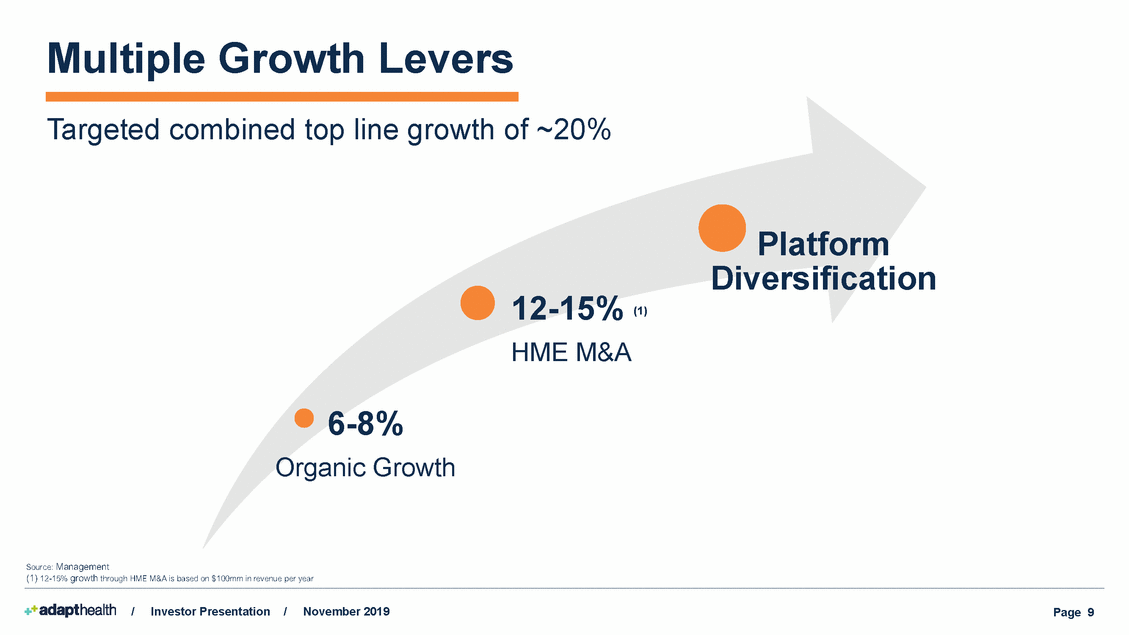
Multiple GrowthLevers Targeted combined top line growth of ~20% Platform Diversification 12-15% (1) HME M&A 6-8% Organic Growth Source: Management (1) 12-15% growth through HME M&A is based on $100mm in revenue per year / Investor Presentation/ November 2019 Page 9
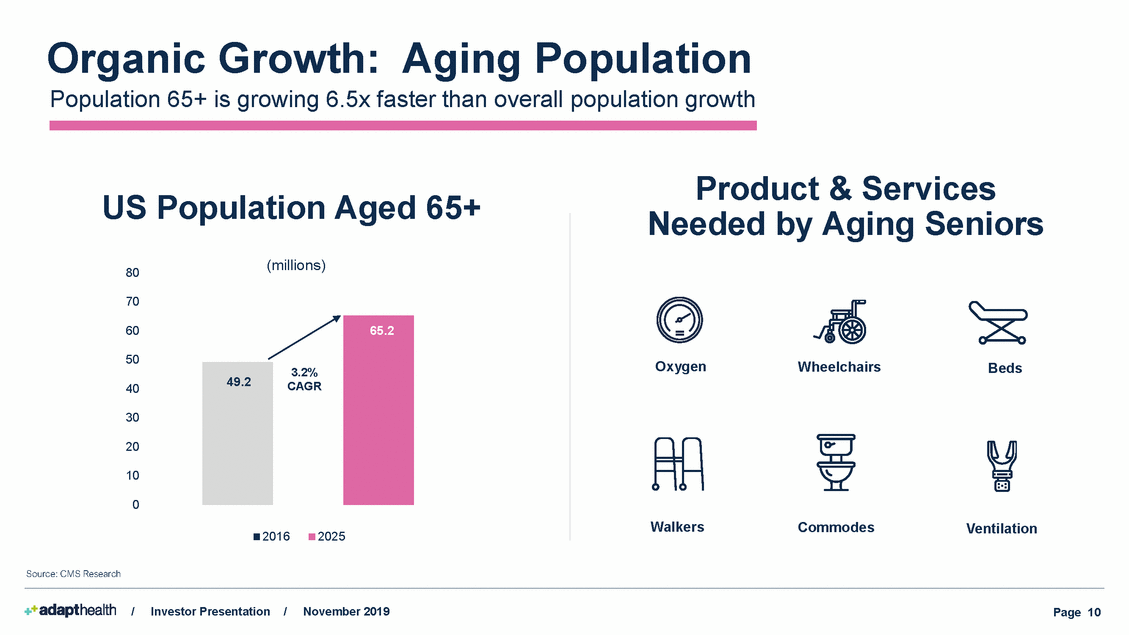
OrganicGrowth: Aging Population Population 65+ is growing 6.5x faster than overall population growth Product & Services US Population (millions) Aged 65+ Needed by Aging Seniors 80 70 60 50 Oxygen Wheelchairs Beds 3.2% CAGR 40 30 20 10 0 Walkers Commodes Ventilation 20162025 Source: CMS Research / Investor Presentation/ November 2019 Page 10 49.2 65.2
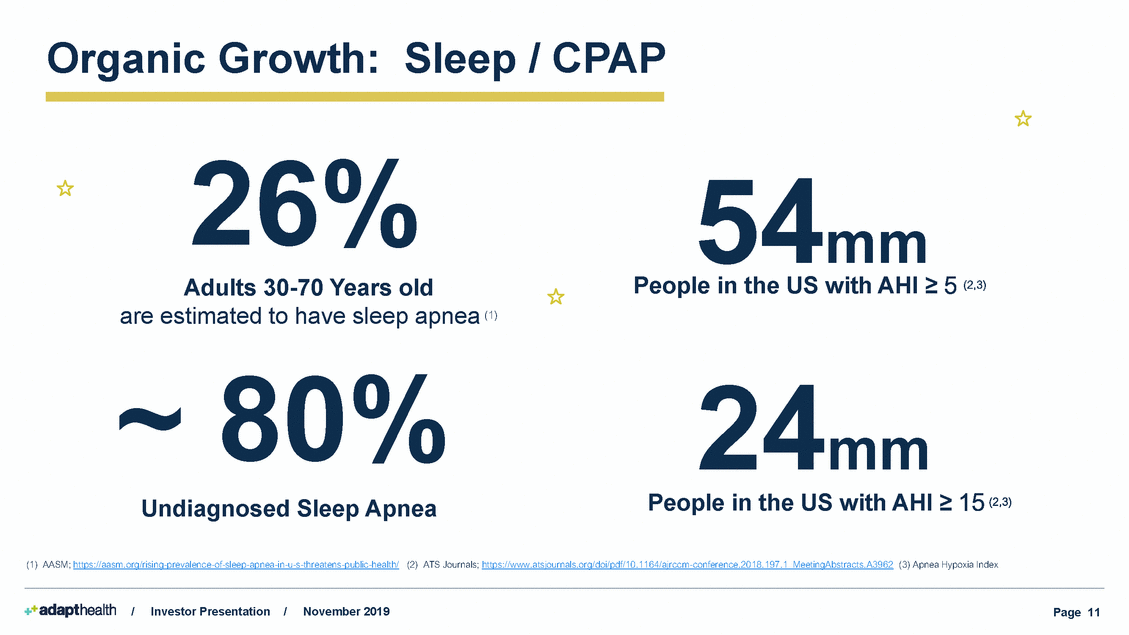
OrganicGrowth: Sleep / CPAP 26% 54mm ~ 80% 24mm (1) AASM; https://aasm.org/rising-prevalence-of-sleep-apnea-in-u-s-threatens-public-health/ (2) ATS Journals; https://www.atsjournals.org/doi/pdf/10.1164/ajrccm-conference.2018.197.1_MeetingAbstracts.A3962 (3) Apnea Hypoxia Index / Investor Presentation/ November 2019 Page 11 Undiagnosed Sleep Apnea People in the US with AHI > 15 (2,3) Adults 30-70 Years old are estimated to have sleep apnea (1) People in the US with AHI > 5 (2,3)
OrganicGrowth: IncreaseHME Mix (1) Opportunity to grow HME revenue by $105mm annually in markets outside of NJ, PA & NY Revenue Mix – NJ / PA / NY Revenue Mix – Other Markets 61% 39% 85% 15% Respiratory/Sleep HME/Other Respiratory/Sleep HME/Other Source: Management. YTD September 30, 2019 (1) $105mm opportunity is based on growing HME business to a mix similar to that of PA, NJ and NY while keeping Respiratory/Sleep revenue flat. / Investor Presentation/ November 2019 Page 12

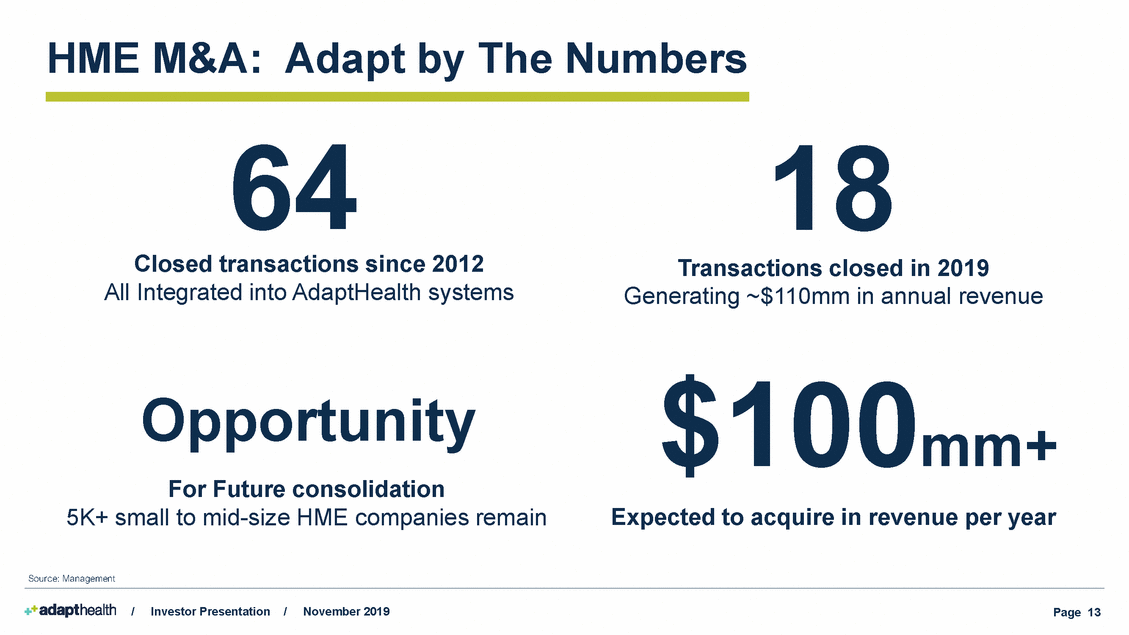
HME M&A: Adapt by The Numbers 64 18 $100mm+ Opportunity Source: Management / Investor Presentation/ November 2019 Page 13 Expected to acquire in revenue per year For Future consolidation 5K+ small to mid-size HME companies remain Transactions closed in 2019 Generating ~$110mm in annual revenue Closed transactions since 2012 All Integrated into AdaptHealth systems
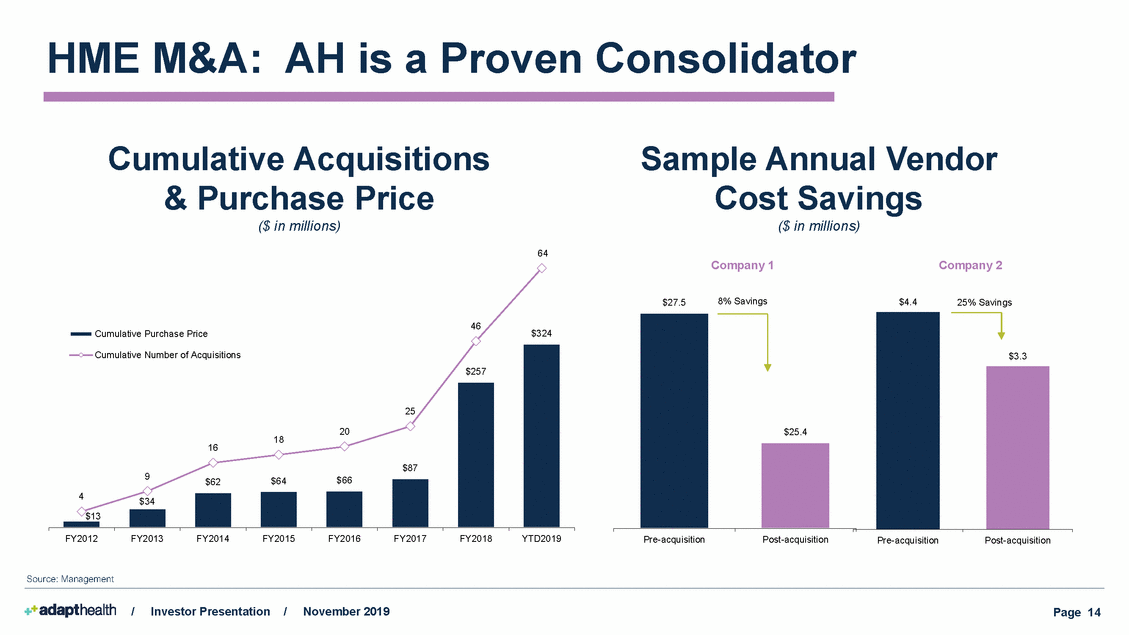
HMEM&A: AHisa Proven Consolidator Cumulative Acquisitions Sample Annual Vendor Cost Savings ($ in millions) & Purchase ($ in millions) Price 64 Company 1 Company 2 8% Savings $4.4 25% Savings $27.5 46 Cumulative Purchase Price $324 18 9 $64 $66 $62 FY2012 FY2013 FY2014 FY2015 FY2016 FY2017 FY2018 YTD2019 Pre-acquisition Post-acquisition Pre-acquisition Post-acquisition Source: Management / Investor Presentation/ November 2019 Page 14 Cumulative Number of Acquisitions $257 25 20 16 $87 4$34 $13 $25.4 $3.3
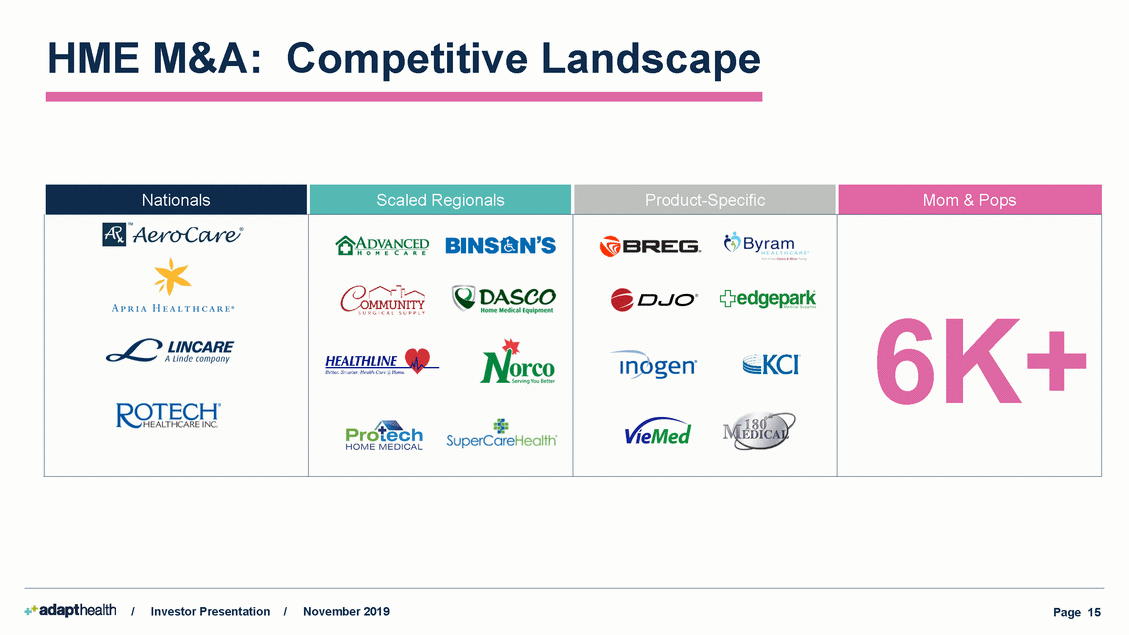
HME M&A: Competitive Landscape / Investor Presentation / November 2019 Page 15 Nationals Scaled Regionals Product-Specific Mom & Pops 6K+
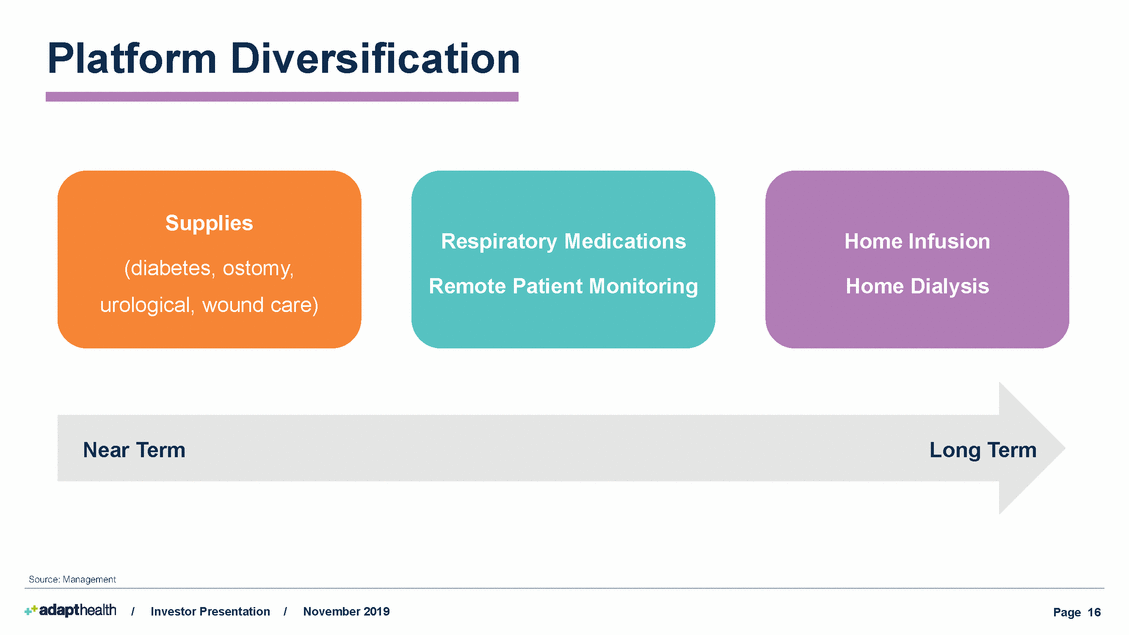
PlatformDiversification Supplies Respiratory Medications Home Infusion (diabetes, ostomy, Remote Patient Monitoring Home Dialysis urological, wound care) Near Term Long Term Source: Management / Investor Presentation/ November 2019 Page 16
Financial Supplement

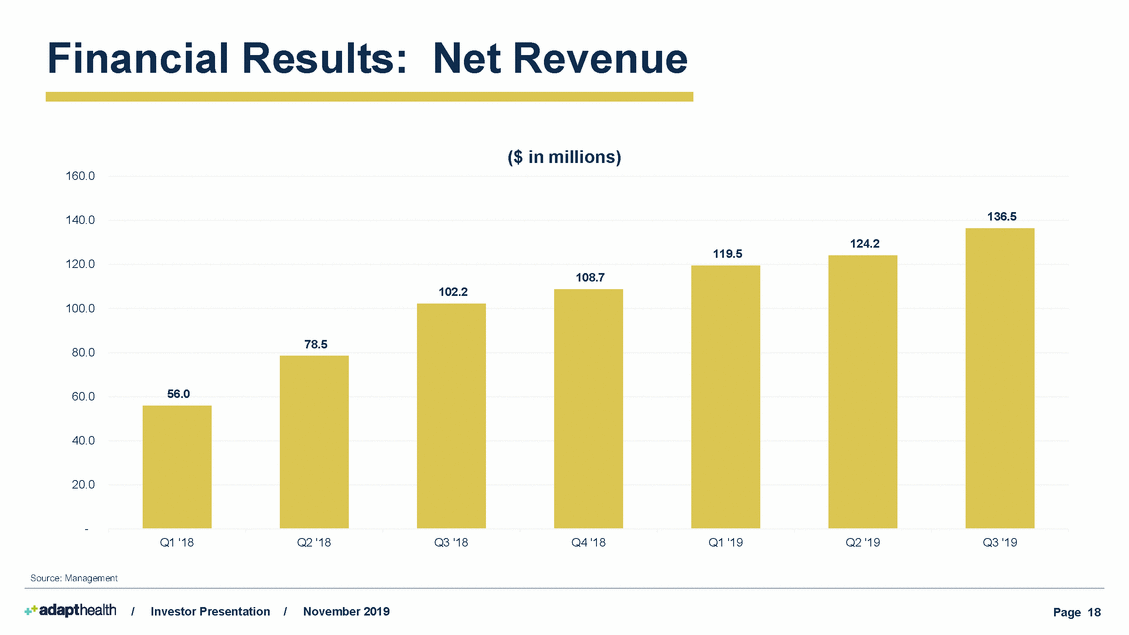
Financial Results: NetRevenue ($ in millions) 160.0 136.5 140.0 119.5 120.0 100.0 80.0 60.0 40.0 20.0 - Q1 '18 Q2 '18 Q3 '18 Q4 '18 Q1 '19 Q2 '19 Q3 '19 Source: Management / Investor Presentation/ November 2019 Page 18 124.2 108.7 102.2 78.5 56.0
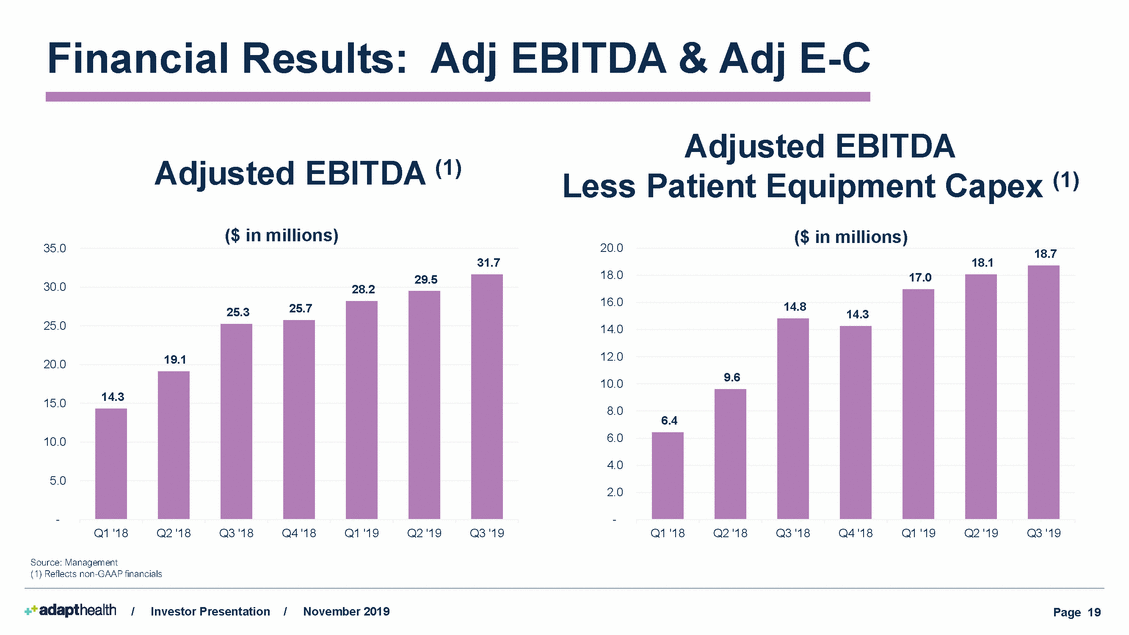
Financial Results: Adj EBITDA & Adj E-C Adjusted EBITDA (1) Adjusted EBITDA (1) Less Patient Equipment ($ in millions) Capex ($ in millions) 35.0 20.0 18.7 31.7 18.1 18.0 30.0 28.2 16.0 25.0 14.0 12.0 20.0 10.0 15.0 8.0 6.0 10.0 4.0 5.0 2.0 - - Q1 '18 Q2 '18 Q3 '18Q4 '18 Q1 '19 Q2 '19 Q3 '19 Q1 '18 Q2 '18 Q3 '18 Q4 '18 Q1 '19 Q2 '19 Q3 '19 Source: Management (1) Reflects non-GAAP financials / Investor Presentation/ November 2019 Page 19 29.5 25.325.7 19.1 14.3 17.0 14.814.3 9.6 6.4
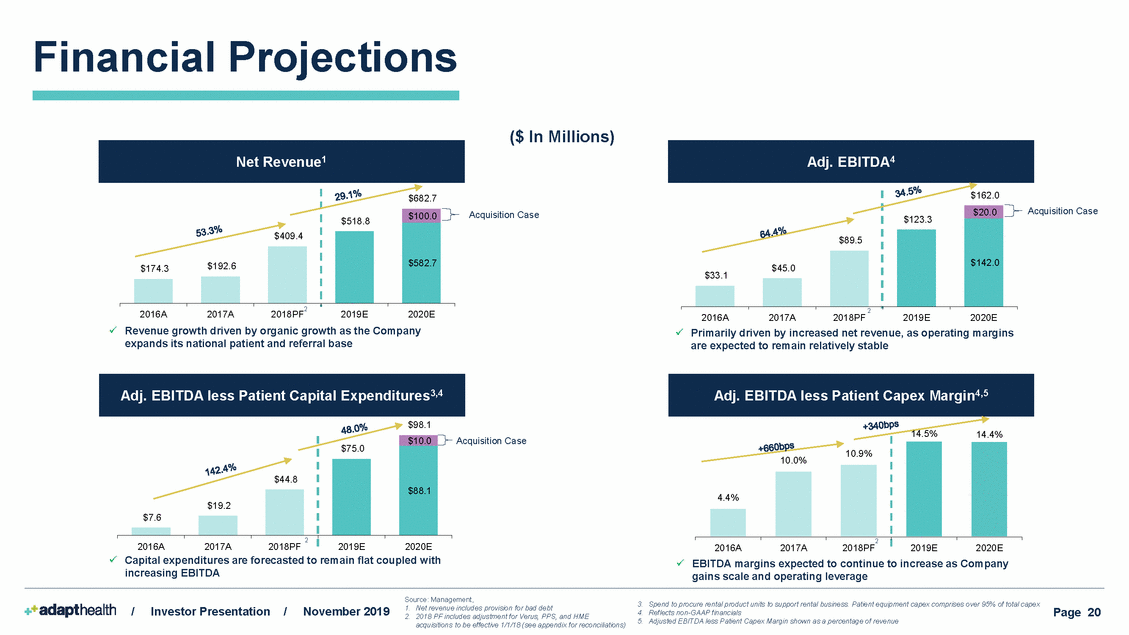
Financial Projections ($ In Millions) Acquisition Case Acquisition Case $33.1 2 2018P 2 2016A 2017A F 2019E 2020E 2016A 2017A 2018PF 2019E 2020E Revenue growth driven by organic growth as the Company expands its national patient and referral base Primarily driven by increased net revenue, as operating margins are expected to remain relatively stable $98.1 14.5% 14.4% Acquisition Case 10.9% 10.0% Capital expenditures are forecasted to remain flat coupled with increasing EBITDA EBITDA margins expected to continue to increase as Company gains scale and operating leverage Source: Management, 1. Net revenue includes provision for bad debt 2. 2018 PF includes adjustment for Verus, PPS, and HME acquisitions to be effective 1/1/18 (see appendix for reconciliations) 3. Spend to procure rental product units to support rental business. Patient equipment capex comprises over 95% of total capex 4. Reflects non-GAAP financials 5. Adjusted EBITDA less Patient Capex Margin shown as a percentage of revenue / Investor Presentation/ November 2019 Page 20 4.4% 2 2016A2017A2018PF 2019E2020E $44.8 $75.0 $10.0 $88.1 $19.2 $7.6 2 2016A2017A2018PF 2019E2020E Adj. EBITDA less Patient Capex Margin4,5 Adj. EBITDA less Patient Capital Expenditures3,4 $409.4 $682.7 $518.8 $100.0 $582.7 $174.3$192.6 $89.5 $162.0 $123.3 $20.0 $142.0 $45.0 Adj. EBITDA4 Net Revenue1
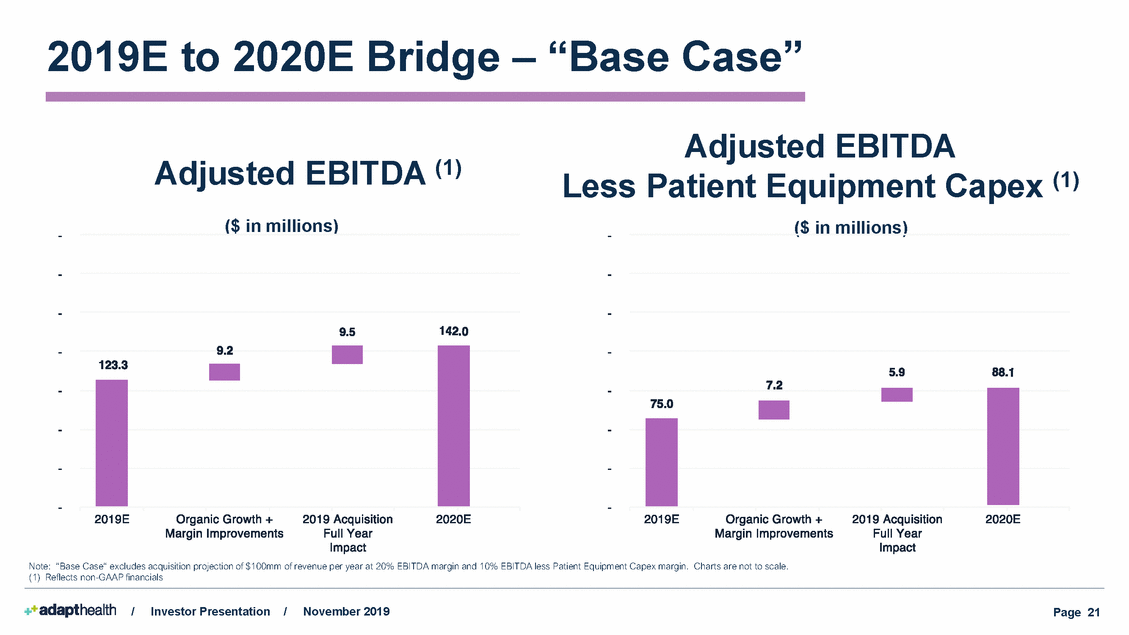
2019Eto2020E Bridge – “Base Case” Adjusted EBITDA Less Patient Equipment Capex (1) Adjusted EBITDA (1) ($ in millions) ($ in millions) Note: “Base Case“ excludes acquisition projection of $100mm of revenue per year at 20% EBITDA margin and 10% EBITDA less Patient Equipment Capex margin. Charts are not to scale. (1) Reflects non-GAAP financials / Investor Presentation/ November 2019 Page 21
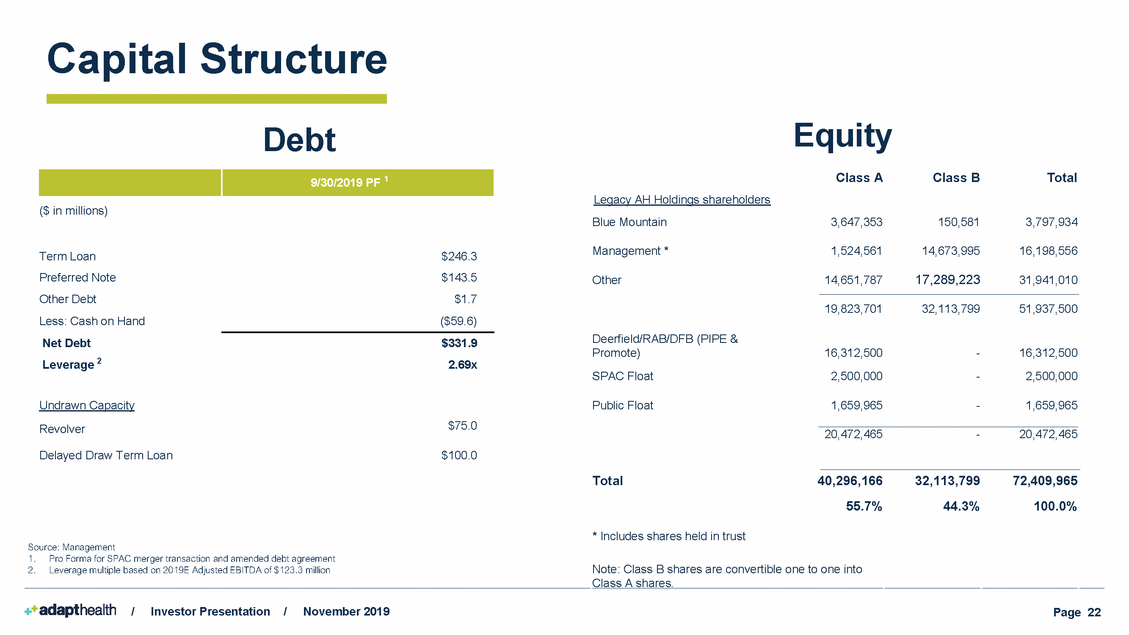
Capital Structure Equity Debt Legacy AH Holdings shareholders 40,296,166 / Investor Presentation/ November 2019 Page 22 ($ in millions) Term Loan$246.3 Preferred Note$143.5 Other Debt$1.7 Less: Cash on Hand($59.6) Net Debt$331.9 Leverage 2 2.69x Undrawn Capacity Revolver$75.0 Delayed Draw Term Loan$100.0 Source: Management 1. Pro Forma for SPAC merger transaction and amended debt agreement 2. Leverage multiple based on 2019E Adjusted EBITDA of $123.3 million Class A Class B Total Blue Mountain3,647,353 150,581 3,797,934 Management *1,524,561 14,673,995 16,198,556 Other14,651,787 17,289,223 31,941,010 19,823,701 32,113,799 51,937,500 Deerfield/RAB/DFB (PIPE & Promote)16,312,500 - 16,312,500 SPAC Float2,500,000 - 2,500,000 Public Float1,659,965 - 1,659,965 20,472,465 - 20,472,465 Total 32,113,799 72,409,965 55.7% 44.3% 100.0% * Includes shares held in trust Note: Class B shares are convertible one to one into Class A shares. 9/30/2019 PF 1
ProForma AdjustedEBITDA Bridge AdaptHealth Pro Forma Adjusted EBITDA Bridge to Net Income Net Income / (Loss) attributable to AdaptHealth Holdings LLC Plus: Income attributable to noncontrolling interest Plus: Interest expense excluding change in FV of interest rate swaps Plus: Interest expense (income) representing change in FV of interest rate swaps Plus: Income tax (benefit) expense Plus: Depreciation Plus: Loss from discontinued ops ($4.2) 0.6 5.8 0.0 (0.2) 26.6 0.4 $9.7 0.6 5.0 0.0 0.2 27.8 0.2 $23.3 1.1 8.0 (0.5) (2.1) 47.9 0.0 Plus: Non-recurring expense adjustments 4.2 1.5 6.9 Plus: Pro forma adjustments1 Verus Adjusted EBITDA PPS Adjusted EBITDA 3.0 0.2 HME Adjusted EBITDA 1.8 Source: Management, 1. Includes the full year effect of the Verus, PPS and HME acquisitions to be effective 1/1/18 / Investor Presentation/ November 2019 Page 23 PF Adj. EBITDA$89.5 Adj. EBITDA$33.1$45.0$84.4 EBITDA$28.9$43.6$77.6 Fiscal Year Ended December 31 2016A2017A2018PF1

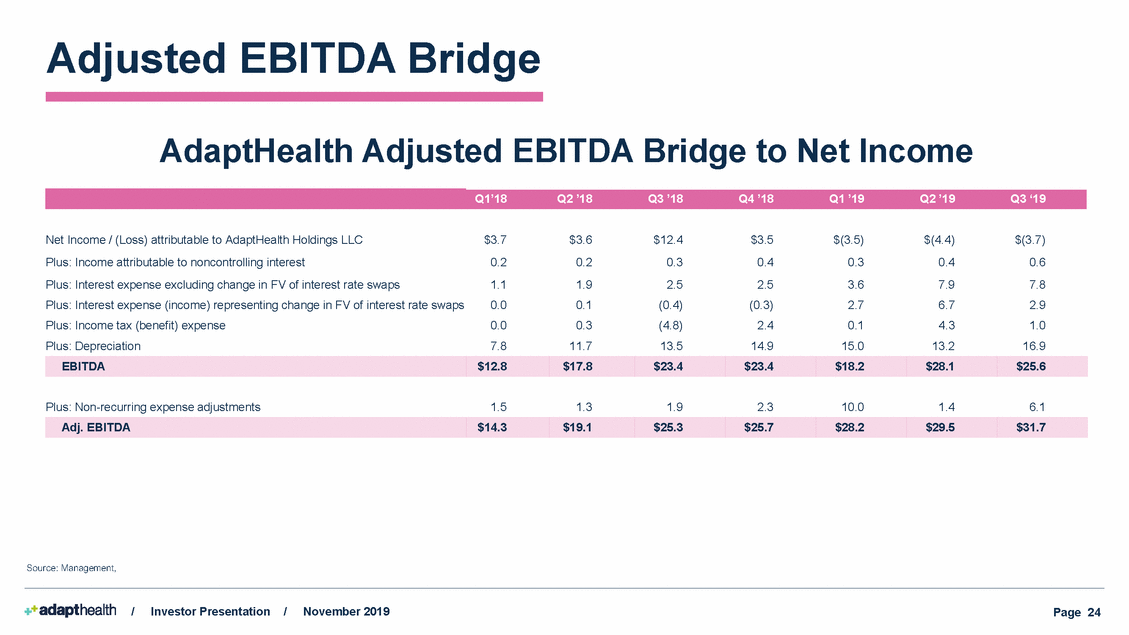
AdjustedEBITDA Bridge AdaptHealth Adjusted EBITDA Bridge to Net Income Net Income / (Loss) attributable to AdaptHealth Holdings LLC Plus: Income attributable to noncontrolling interest Plus: Interest expense excluding change in FV of interest rate swaps Plus: Interest expense (income) representing change in FV of interest rate swaps Plus: Income tax (benefit) expense Plus: Depreciation $3.7 0.2 1.1 0.0 0.0 7.8 $3.6 0.2 1.9 0.1 0.3 11.7 $12.4 0.3 2.5 (0.4) (4.8) 13.5 $3.5 0.4 2.5 (0.3) 2.4 14.9 $(3.5) 0.3 3.6 2.7 0.1 15.0 $(4.4) 0.4 7.9 6.7 4.3 13.2 $(3.7) 0.6 7.8 2.9 1.0 16.9 Plus: Non-recurring expense adjustments 1.5 1.3 1.9 2.3 10.0 1.4 6.1 Source: Management, / Investor Presentation / November 2019 Page 24 Adj. EBITDA$14.3$19.1$25.3$25.7$28.2$29.5$31.7 EBITDA$12.8$17.8$23.4$23.4$18.2$28.1$25.6 Q1’18Q2 ’18Q3 ’18Q4 ’18Q1 ’19Q2 ’19Q3 ‘19
Thank You!